
FIGURE
Fig. 3
- ID
- ZDB-FIG-060203-13
- Publication
- Bollig et al., 2006 - Identification and comparative expression analysis of a second wt1 gene in zebrafish
- Other Figures
- All Figure Page
- Back to All Figure Page
Fig. 3
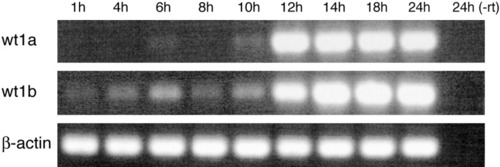
Temporal expression pattern of wt1a and wt1b during early zebrafish development. Analysis was performed by reverse transcriptase-polymerase chain reaction (PCR) using embryos of the stages indicated. Sizes of the amplified products were 520 bp for wt1a, 560 bp for wt1b, and 400 bp for β-actin, which was used as a reference. To verify the absence of genomic DNA contamination, an aliquot of the 24 hours postfertilization RNA sample was used for PCR without reverse transcription (-rt). h, hours postfertilization. |
Expression Data
| Genes: | |
|---|---|
| Fish: | |
| Anatomical Term: | |
| Stage Range: | 4-cell to Prim-5 |
Expression Detail
Antibody Labeling
Phenotype Data
Phenotype Detail
Acknowledgments
This image is the copyrighted work of the attributed author or publisher, and
ZFIN has permission only to display this image to its users.
Additional permissions should be obtained from the applicable author or publisher of the image.
Full text @ Dev. Dyn.