|
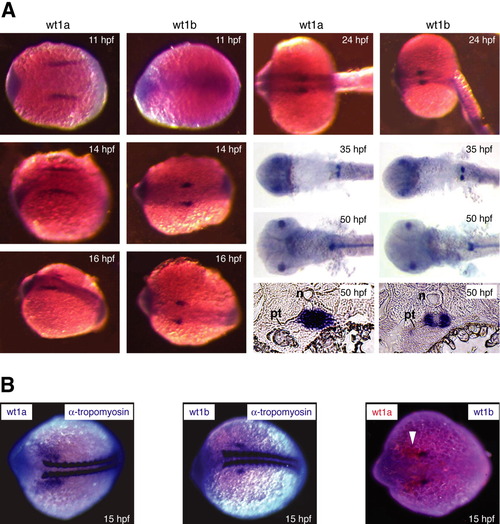
Expression of two wt1 genes in the developing zebrafish. A: Embryos were collected at the desired stages (hpf, hr postfertilization) and subjected to whole-mount in situ hybridization using wt1a and wt1b probes. Signals in the eyes at 35 and 50 hours postfertilization (hpf) as well as in the notochord at 50 hpf can also be observed using the respective sense controls (data not shown) and, therefore, are due to probe trapping. The two right bottom panels show adjacent cross-sections of the anterior glomerular region of a 50 hpf embryo that have been hybridized with wt1a and wt1b probes, respectively. n, notochord; pt, pronephric tubule. B: Double whole-mount in situ hybridizations were performed using probes against wt1a and the somite marker α-tropomyosin (left), wt1b and α-tropomyosin (middle), as well as against both wt1 genes simultaneously (right). The arrowhead marks the wt1a expression domain.
|