|
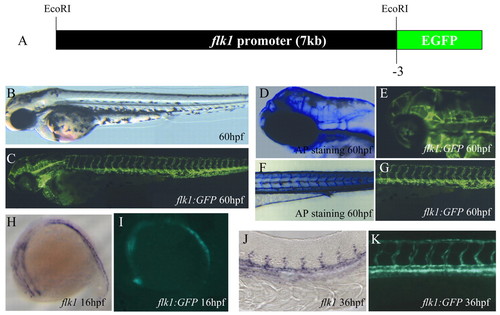
Generation of the Tg(flk1:EGFP)s843 line. (A) A 6.5 kb upstream sequence of zebrafish flk1 was used to generate the Tg(flk1:EGFP)s843 line. (B) Bright-field micrograph of a 60 hpf Tg(flk1:EGFP)s843 embryo. (C) Epifluorescence micrograph of the same embryo. (D) Head vasculature of a 60 hpf embryo visualized by endogenous alkaline phosphatase (AP) activity. (E) Similar area in a Tg(flk1:EGFP)s843 embryo. (F) Trunk vasculature of a 60 hpf embryo visualized by endogenous AP activity. (G) Similar area in a Tg(flk1:EGFP)s843 embryo. (H) flk1 expression at 16 hpf in a 16 hpf embryo. (I) Expression of GFP at the same stage. (J) flk1 expression at 36 hpf in a 36 hpf embryo. (K) Expression of GFP at the same stage. The flk1:EGFP transgene recapitulates flk1 expression and allows higher resolution analyses than staining for flk1 expression or AP activity.
|