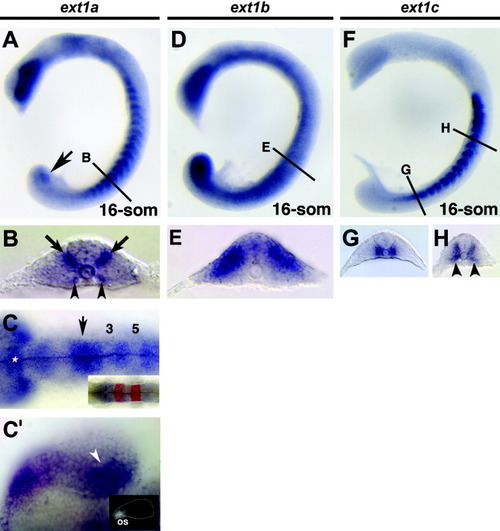
Figure 3. Expression of ext1a (A-C,C), ext1b (D,E), and ext1c (F-H) at the 16-somite stage. Anterior of the embryos is to the left. A: Expression of ext1a can be detected in the eye, the dorsal neural tube, Kupffer′s vesicle (black arrow), and the somites. B: Cross-section at the level of the 12th somite. Expression of ext1a can be detected in the anterior hindbrain (arrow) and the dorsal diencephalon (asterisk). C: Dorsal view on the brain of the embryo in A. Krox20 demarcates rhombomeres 3 and 5 (inset). C: Expression of ext1a in the eye, which do not express ext1a. In addition, ext1a transcripts can be detected in two ventromedial (arrowheads) and two dorsomedial (arrows) domains. D: RNA encoding ext1b is expressed more ubiquitously with domains of higher expression in the tailbud region, the eye, and dorsal somites. E: Section at the level of the 9th somite, revealing expression of ext1b in the dorsal aspect of the somite. F: Alternating expression domains of ext1c can be detected in the somites. G: Cross-section of the embryo in F at the level of the 16th somite. H: Cross-section at the level of the 6th somite, revealing expression of ext1c in ventromedial regions of the somites (arrowheads) and adjacent to the neural tube.
|
