|
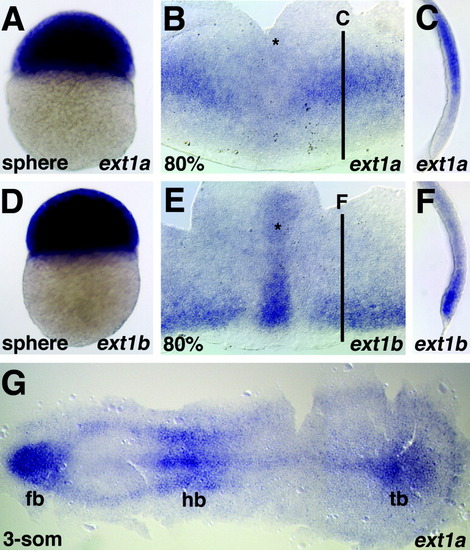
Figure 2. Expression of ext1a (A-C,G) and ext1b (D-F), anterior to the top (A-F), or to the left (G). A: Sphere stage. B: Eighty percent of epiboly. The embryo was opened at the ventral side and flat-mounted, dorsal side up. Ext1a transcripts can be detected in two wings in the prospective hindbrain region lateral to the embryonic midline (marked by asterisk). C: Cross-section of the embryo shown in B. D: Sphere stage. E: Eighty percent epiboly stage. Orientation of the embryo as in B. Ext1b RNA can be detected in the embryonic midline (marked by asterisk) and in the germ ring. F: Cross-section of the embryo in E. G: At the three-somite (3-som) stage, ext1a is expressed in the forebrain (fb), the hindbrain (hb), and in the tailbud (tb).
|