
- Title
-
Determination of the zebrafish forebrain: induction and patterning
- Authors
- Grinblat, Y., Gamse, J., Patel, M., and Sive, H.
- Source
- Full text @ Development
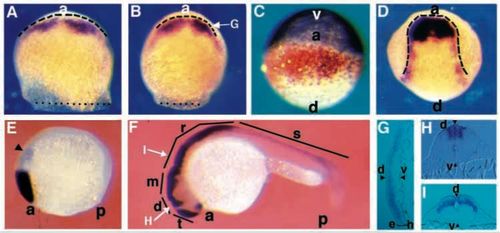
Zebrafish opl is expressed in the anterior neural plate and dorsal neural tube. Staged embryos were stained for opl RNA (purple, except in C, where it is orange) and gta3 RNA (purple in C) using whole-mount in situ hybridization. (A) Mid-gastrula (75% epiboly)embryo, dorsal view, dotted line indicates blastoderm margin, dashed line indicates anterior neural boundary. (B) Late gastrula (90% epiboly), dorsal view; dotted line indicates blastodermmargin, arrow indicates plane of section shown in G. (C) Late gastrula (90% epiboly), anterior view. (D) Early neurula (tailbud) embryo, dorsal view, dashed line outlines the neural plate. (E) Early somitogenesis (5 somites),side view, arrowhead indicates a weak posterior domain of staining. (F) Late somitogenesis (prim-5), side view, arrows indicate planes of section shown in H and I. (G) Transverse section through a late gastrula (90% epiboly) stage embryo as shown in D, showing that opl expression is confined to the epiblast (e) and is excluded from the hypoblast (h) (mesendoderm) layers (bracketed). Arrowheads mark dorsal and ventral limits of the blastoderm. (H,I) Transverse section through (H) the diencephalon, (I) the rhombencephalon; note restriction of expression to dorsal neural tube, arrowheads mark dorsal and ventral limits of the blastoderm. a, anterior; d, dorsal; v, ventral; p, posterior; t, telencephalon; d, diencephalon; m, mesencephalon; r, rhombencephalon; s, spinal cord. EXPRESSION / LABELING:
|
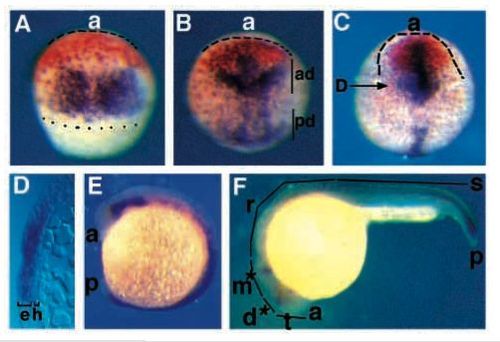
opl and fkh5 are expressed in adjacent domains that mark presumptive telencephalon and diencephalon at gastrula. Staged embryos were stained for opl RNA (orange) and fkh5 RNA (purple) using whole-mount in situ hybridization. (A) Mid-gastrula (75% epiboly) embryo, dorsal view, dotted line marks blastoderm margin; dashed line outlines anterior neural plate. (B) Late gastrula (90% epiboly) embryo, dorsal view; ad, anterior domain of fkh5 expression; pd, posterior domain of fkh5 expression. (C) Early neurula (tailbud) embryo, dorsal view, arrow shows plane of section shown in D. (D) Transverse section through a tailbud stage embryo. Note that staining is strong in the epiblast (e) and excluded from hypoblast (h). (E) Early somitogenesis (5 somite) embryo, side view. (F) Late somitogenesis (prim-5) embryo, side view, asterisks indicate weak fkh5 staining. a, anterior; t, telencephalon; d, diencephalon; m, mesencephalon; p, posterior; r, rhombencephalon; s, spinal cord. EXPRESSION / LABELING:
|
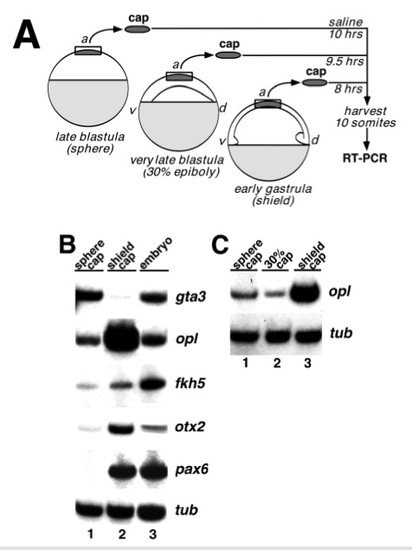
Explant assays show that neural specification occurs by early gastrula. (A) Schematic outline of the explant assay. Animal caps were explanted from sphere stage, 30% epiboly stage,or shield stage embryos. Caps were combined in groups of 5-10 and cultured until control embryos reached mid-somitogenesis, when they were assayed by a reverse transcriptase-PCR (RT-PCR) assay for expression of marker genes, as described in Materials and Methods. (B) RT-PCR analysis of gene expression in animal cap explants. The following markers were assayed: gta3 (Neave et al., 1995), a marker of ventral ectoderm; opl, a marker of prospective telencephalon; fkh5, a marker ofprospective diencephalon, mesencephalon and spinal cord; otx2 (Li et al., 1994), a marker of prospective telencephalon, diencephalon, and mesencephalon; pax6 (Krauss et al., 1991), a marker of prospective diencephalon, hindbrain and spinal cord, and α-tubulin (G. Conway, personal communication), a loading control. Each lane represents a pool of five explants. The data shown here is representative of 2 experiments each for gta3, otx2 and pax6, 3 experiments for fkh5 and 5 experiments for opl. Lane 1: explants from sphere stage embryos; lane 2: explants from shield stage embryos; lane 3: whole embryo controls. (C) RT-PCR analysis of opl expression in animal cap explants from a later blastula stage. Dissections were done as in A using embryos at 30- 35% epiboly. Lane 1: explants from sphere stage embryos; lane 2: explants from 30-35% epiboly stage embryos; lane 3: explants from shield stage embryos. |
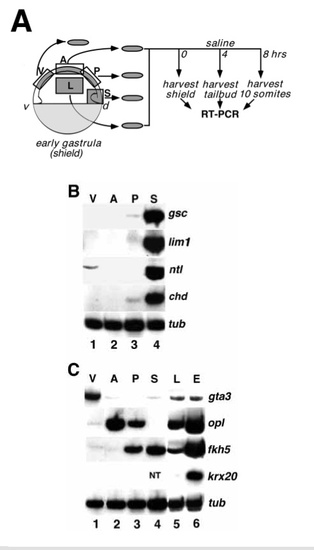
Forebrain pattern is specified at early gastrula. (A) Schematic outline of the explant assay. Four segments of early gastrula (shield stage) epiblast were isolated: ventral epiblast (V), anterior dorsal epiblast (A), posterior dorsal epiblast (P) and lateral epiblast (L). Explants of embryonic shield (S) contained a mixture of presumptive ectoderm, mesoderm and endoderm. All explants were combined in groups of 5 and harvested immediately (B) or cultured until control embryos reached tailbud or 10 somite (C) stage before analysis of marker gene expression by RT-PCR (see Methods). (B) RT-PCR analysis of explants harvested immediately after dissection and assayed for expression of dorsal mesendodermal markers gsc (Stachel et al., 1993; Thisse et al., 1994) and lim1 (Toyama et al., 1995), both markers of the axial hypoblast of the shield (prospective prechordal plate), ntl (Schulte-Merker et al., 1994), a marker of the entire mesendoderm, and chd (Miller-Bertoglio et al., 1997) a marker of the dorsal mesendodorm. α-tubulin (G. Conway, personal communication) was used as loading control. The data shown here is representative of 2 experiments. Lane 1: ventral explant; lane 2: anterior dorsal explant; lane 3: posterior dorsal explant; lane 4: shield explant. (C) RT-PCR analysis of cultured explants assayed for expression of ectodermal markers gta3 (Neave et al., 1995), a marker of ventral ectoderm, opl, a marker of prospective telencephalon, fkh5, a marker of prospective diencephalon, mesencephalon and spinal cord, krx20 (Oxtoby and Jowett, 1993), a marker of prospective rhombencephalon,and α-tubulin (G. Conway, personal comunication),aloading control. Each lane represents a pool of five explants. The data shown is representative of 3-4 independent experiments. Lane 1: ventral explants; lane 2: anterior dorsal explants; lane 3: posterior dorsal explants; lane 4: shield explants; lane 5: lateral ectoderm explants; lane 6: whole embryo control. NT: not tested. |
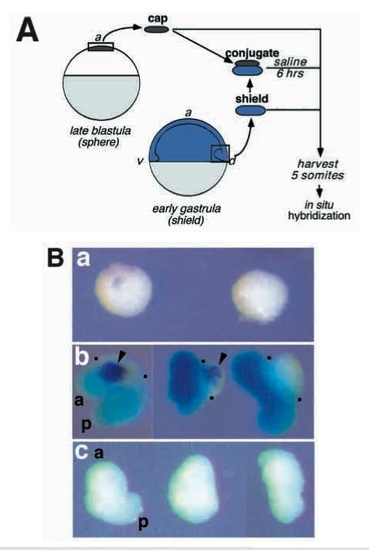
Early gastrula organizer (shield) induces oplexpression in animal caps. (A) Schematic outline of the conjugation experiment. Animal cap explants from late blastula (sphere stage) embryos were cultured either in isolation, in groups of 10, or as conjugates with shields explanted from early gastrula (shield stage) embryos. Each conjugate was made with one shield and 5 animal caps. As a control, shields were cultured alone. For conjugates, embryos from which shields were isolated were lineage labeled with FLDX (pale blue; see Methods) in order to distinguish inducing from responding tissues. Explants were cultured until shield-donor embryos reached the 5 somite stage, at which time the explants were harvested and stained for opl RNA (purple) by in situ hybridization. (B) Cultured explants, stained for the presence of opl RNA (purple) and lineage label (blue). (a) Two groups of 10 animal caps cultured in isolation. (b) Three conjugates representative of the typical outcomes of the experiment. Dots mark the anterior and posterior edges of the animal cap-derived tissues. (c) Shield explants cultured in isolation. A total of 38 conjugates were made in 7 independent experiments. Induction of oplwas observed in 58% of them, and was always restricted to the animal cap-derived portion. No detectable oplexpression has been observed in more than 40 shield explants generated in at least 5 experiments. Abbreviations: a, anterior; p, posterior. |
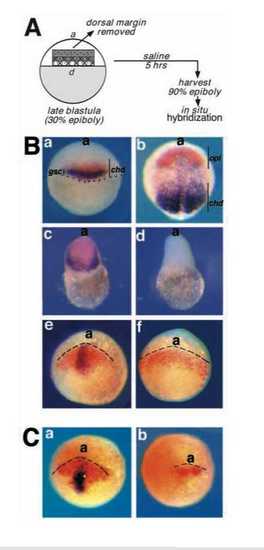
Dorsal mesendoderm is required for the gastrula expression of opl. (A) Schematic outline of the extirpation experiment. The dorsal margin of a late blastula embryo, morphologically distinct from the ventral margin at 30% epiboly, was removed by microdissection. Three distinct regions were removed: the stippled region, corresponding approximately to the chd-expressing region, the hatched region, corresponding approximately to the gsc-expressing region, and the solid gray region, corresonding to the animal portion of the presumptive organizer region. Resulting embryos were cultured until control embryos reached 90% epiboly when they were stained by in situ hybridization (B,C) for genes listed below (see also Results and Materials and Methods). (B) (a,b) Control wild-type embryos; (c,e) control microsurgery; (d,f) removal of the presumptive shield/organizer region. (a) Dorsal view of a wild-type embryo at early gastrula (shield stage) stained for gsc (purple) and chd RNA (orange); (b) dorsal view of a wild-type embryo at late gastrula (90% epiboly) stained for chd (purple) and opl RNA (orange). (c) Embryo generated by removing the animal portion of the presumptive organizer region (solid gray in Fig. 7A), cultured until 90% epiboly stage equivalent and stained for opl (orange) and chd (purple). 5 out of 5 embryos obtained in 1 experiment expressed opl and chd. (d) Embryo generated by complete removal of the presumptive organizer region (stippled in A), cultured until 90% epiboly stage equivalent, and stained for opl (orange) and chd (purple). 8 out of 23 embryos generated in 4 experiments failed to express chd, and were also devoid of opl RNA. The remaining 15 out of 23 embryos expressed chd and opl, probably due to incomplete organizer removal. (e) Mock dissected embryos at 90% epiboly stage equivalent, stained for opl (orange) and gsc (purple). 11 out of 11 embryos generated in 4 experiments expressed both opl and gsc. (f) Embryo generated by removing part of the presumptive organizer region (hatched in A), cultured to 90% epiboly equivalent, and stained for opl (orange) and gsc (purple). 10 out of 17 embryos generated in 4 experiments failed to express gsc, but were able to express and pattern opl. In addition, 1 embryo was obtained which was free of both gsc and opl staining. (C) Analysis of one eyed pinhead mutant embryos. Embryos resulting from a cross between oep te57 heterozygotes (39 total) were analysed at tailbud stage by in situ hybridization for expression of opl (orange) and gsc (purple). (a) Wild-type embryo, representative of 30 out of 39 embryos; (b) sibling embryo homozygous for the oep mutant allele, identified by failure to express gsc (9 out of 39 embryos). opl was patterned but expressed at lower levels. |
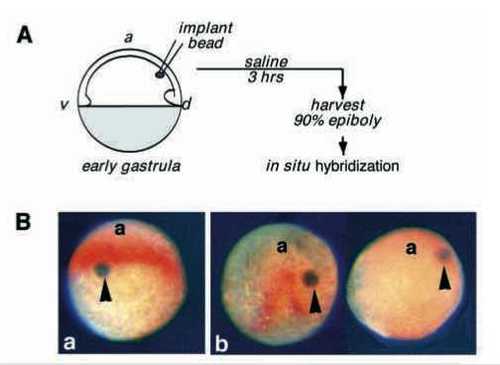
BMP4 inhibits opl expression in whole embryos. (A) Diagram of the experiment. Sepharose beads, coated with BSA or BMP4 (see Methods), were inserted into the dorsal side of shield stage embryos, between the yolk cell and the epiblast. Embryos were harvested at 90% epiboly stage equivalent and assayed for expression of opl (orange) by in situ hybridization. (B) Dorsoanterior views of representative embryos in which control BSA-coated (a) or BMP4- coated (b) Sepharose beads had been implanted. (A) A control embryo with implanted BSA-coated bead (arrowhead). Seven such embryos were obtained in 3 experiments. (b) Embryos obtained after implantation of BMP4 coated beads. 11 embryos generated in 3 experiments had BMP4 beads located dorsally (arrowheads); 3 of these did not express opl (like the embryo on the right), the other 8 showed partial ablation of the opl domain proximal to the bead (like the embryo on the left). a, anterior. |