
- Title
-
Analysis of FGF function in normal and no tail zebrafish embryos reveals separate mechanisms for formation of the trunk and the tail
- Authors
- Griffin, K., Patient, R., and Holder, N.
- Source
- Full text @ Development
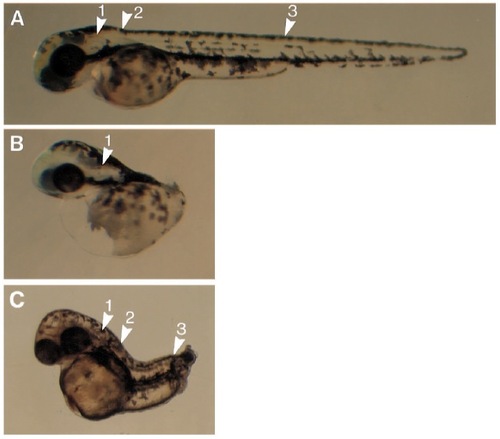
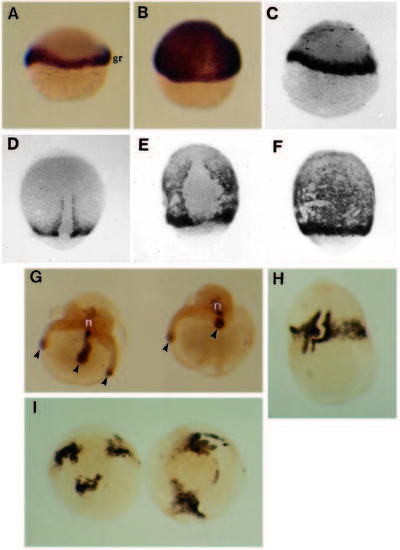
Effect of inhibition of the FGF-receptor on normal development. Live embryos at 48 hpf. (A) Normal embryo, arrows indicate otic vesicle (1), somite 1 (2), and somite 17 (3). (B) Extreme phenotype resulting from expression of the dominant negative FGF-receptor: all structures posterior to the otic vesicle are missing. (C) Homozygous no tail mutant, which lacks only the body axis posterior to somite 17-19, and the notochord. |
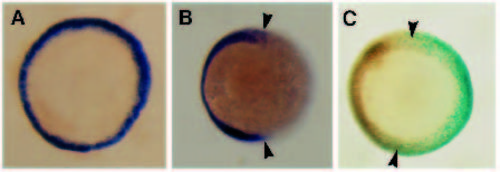
Effect of the dominant negative FGFR on ntl expression during gastrulation. ntl expression at 50-60% epiboly, polar views, (A,B) in situ hybridisations (purple stain), (C) antibody staining (brown nuclei). In the normal embryo (A) ntl expression appears as a ring of staining throughout the germ ring. (B) Embryo injected with dominant negative FGFR RNA, showing gaps (arrowheads) in Ntl expression. (C) Embryo injected with the dominant negative FGFR and with lac-Z RNA to monitor its distribution; gaps in Ntl staining (arrowheads) correspond with the distribution of β-gal activity (blue nuclei). |
Development of muscle and notochord after inhibition of the FGFR. Dorsal views of embryos at the 14 somite stage, anterior at the top, labelled with antibodies to Ntl and myosin. (A) Normal embryo. The notochord (large arrowhead) is visible in the centre of the embryo running into the tail bud, with bands of myosin staining on either side (small arrowheads). (B) Embryos expressing the dominant negative FGFR showed a range of defects: left embryo has normal myosin-staining and notochord; centre embryo lacks myosin staining on its right side and has a large number of blue cells on this side; right embryo lacks all myosin staining and notochord was only present in the hind-brain. These defects corresponded with a large number of blue cells on both sides of the embryo. (C,D) Distribution of cells inheriting injected RNAs was monitored at 16 hpf using β- gal activity (blue nuclei). (C) Lateral view, anterior to the right, of embryo injected with the control receptor, D50, showing an even distribution of stained cells throughout the anteroposterior axis. (D) Similar embryo injected with the dominant negative receptor, showing stained cells almost exclusively in the head. EXPRESSION / LABELING:
|
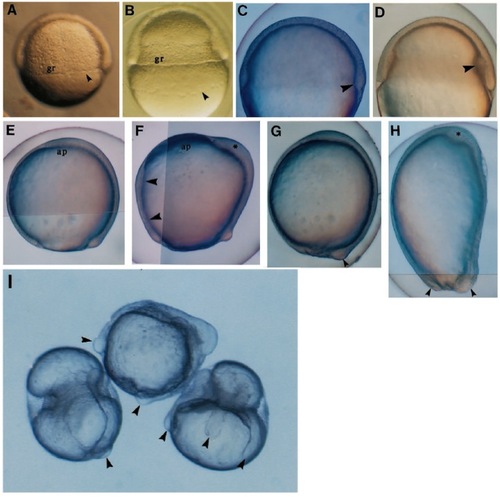
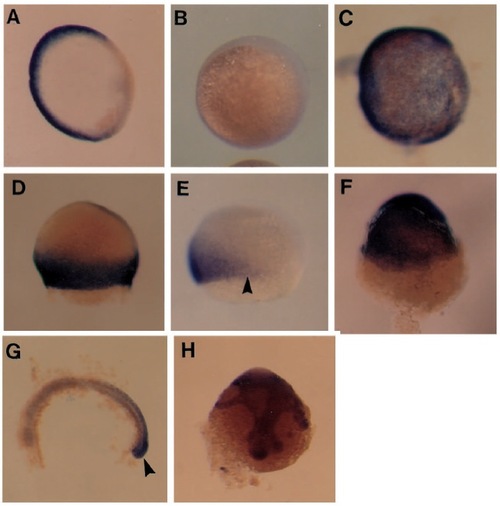
Appearance of live embryos after over-expression of eFGF. (A-D) Lateral views of embryos at 50% epiboly, (E-H) lateral views of late gastrulation stages, dorsal to the right, anterior at the top, (I) 18 hpf. (A) In the normal embryo the germ ring (gr) is barely visible and the yolk syncytial layer (YSL, arrowhead) is just below the margin of the epiblast. A similar view of an injected embryo (B) with a greatly enlarged germ ring. The distance between the cells of the YSL (arrow) and the epiblast margin is greater than normal, and the YSL has migrated further toward the vegetal pole. When viewed with Nomarski optics, it is clear that the enlargement is in the hypoblast (compare arrowed structures in C, a normal embryo, with D, an injected embryo). (E) Normal embryo at 90% epiboly; the shield cells have migrated to the animal pole (ap). In the injected embryo (F) these cells have failed to reach this position and an abnormal accumulation of cells is forming (asterisk). Note the increased thickness of the ventral hypoblast (arrowheads). (G) Normal embryo at 10 hpf (arrowhead = tail bud). (H) An injected embryo at the same stage showing an abnormal accumulation of cells at the top of the embryo (asterisk) and more than one thickening in the region of the tail-bud (arrowheads). (I) Embryos at 18 hpf showing a range of abnormal morphologies. The central embryo has a large accumulation of tissue on top of the yolk cell, whereas the left and right embryos have belts of tissue constricting the yolk cell. A variable number of axis-like extensions (arrowheads) have formed. |
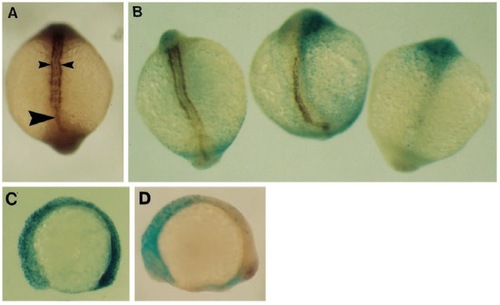
Effect of eFGF on the expression patterns of ntl, sna1 and myosin. (A) Lateral view of normal embryo at the germ ring stage showing ntl expression restricted to the germ ring (gr). (B) Similar embryo injected with eFGF, showing ubiquitous ntl expression. (C) eFGF-injected embryo at the onset of gastrulation, showing normal distribution of sna1 transcripts in the germ ring (black dots over the animal pole are processing artefacts). (D,E,F) sna1 expression at 80-90% epiboly. (D) Normal embryo at 80% epiboly showing expression restricted to the hypoblast of the germ ring and adaxial cell on either side of the notochord progenitors. (E) Dorsal and (F) ventral view of an eFGF-injected embryo at 9 hpf. sna1 is now expressed throughout the hypoblast, except on the dorsal side (as normal). (G) Injected embryos at 18 hpf. Ntl protein was detected in the notochord (n) and in mesenchymal cells at the ends of the axial extensions (arrowheads). Embryos only ever contained one notochord. (H,I) Myosin staining in injected embryos at 18 hpf. The embryo in H shows myosin staining throughout the belt of tissue, with segmental staining running either side of the notochord (n). (I) Polar view of injected embryos with several separate regions of myosin staining, corresponding in number and position to the axial-extensions. EXPRESSION / LABELING:
|
FGF-dependent regulation of eve1 and cad1 expression. (A-C) Animal pole views of eve1 expression at the shield stage. In a normal embryo (A) eve1 is only expressed in the ventral and lateral germ ring. (B) This embryo has been injected with the dominant negative FGFR and no eve1 expression can be detected. (C) An embryo injected with eFGF RNA and showing ubiquitous expression of eve1. (D-F) Lateral views of cad1 expression during early gastrulation. (D) Normal embryo at 65% epiboly showing strong cad1 expression throughout the germ ring. (E) Embryo injected with dominant negative FGFR RNA, with a clear gap (arrowhead) in cad1 expression. (F) Embryo injected with eFGF RNA; cad1 is expressed ubiquitously. (G,H) Lateral views of cad1 expression at 18 hpf. (G) Normal embryo, anterior to the right, with yolk cell dissected away. cad1 is only expressed in the tail region, especially in the tail bud (arrowhead). (H) Injected embryo showing that ubiquitous expression of cad1 persists to this stage. EXPRESSION / LABELING:
|
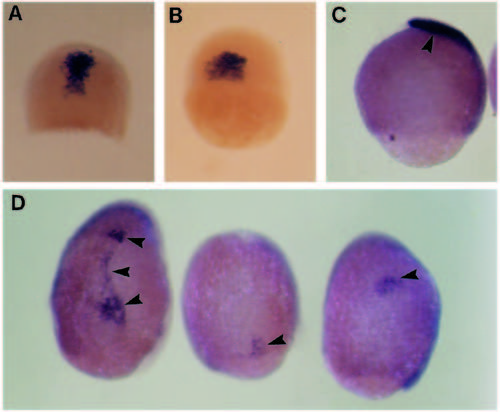
Effect of eFGF over-expression on gsc expression. (A) Normal embryo at shield stage; gsc is expressed in a single group of cells on the dorsal side. (B) Injected embryo, showing normal gsc expression for this stage. (C) Lateral view of normal embryo at 9 hpf; gsc-expressing cells have migrated to the animal pole (arrowhead) and still strongly express this gene. (D) Dorsal view, animal pole at the top, of injected embryos. gsc expression is very weak, and the expressing cells are in abnormal locations (arrowheads). EXPRESSION / LABELING:
|
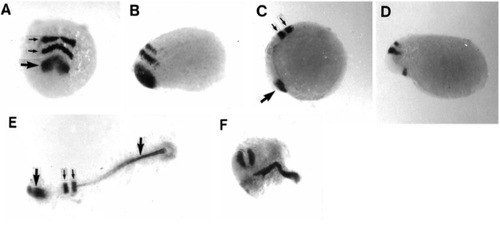
Expression patterns of anterior markers after eFGF overexpression. (A) A normal 3-somite embryo viewed from the anterior end showing pax2 RNA at the midbrain-hindbrain border (large arrow) and krx-20 RNA in hindbrain rhombomeres 3 and 5 (small arrows). (B) Lateral view, anterior to the left, of eFGFinjected embryo showing pax2 and krx-20 close to the presumptive anterior limit of the embryo. (pax2 expression was absent in one-third of injected embryos at the 10-somite stage.) (C) Normal expression pattern of isl1 in the pillow (large arrow) and krx-20 in the hindbrain (small arrows) in a 3-somite embryo (lateral view, anterior to the left). (D) Injected embryo at a similar stage (orientated as in C), showing the marked decrease in the distance between these two markers. (E) Dorsal view of flat-mounted 3 somite embryo, anterior to the left, showing the normal expression domains of rtk1. From left to right these are the forebrain (large arrow), rhombomeres 3 and 5 (small arrows), and notochord (large arrow). (F) Dorsal view of injected embryo, anterior to left, showing strong expression in the hindbrain rhombomeres and the notochord, which is broader than normal, but with no discernible forebrain expression. EXPRESSION / LABELING:
|