
- Title
-
Expression of the zebrafish gene hlx-1 in the prechordal plate and during CNS development
- Authors
- Fjose, A., Izpisúa Belmonte, J.C., Fromental-Ramain, C., and Duboule, D.
- Source
- Full text @ Development
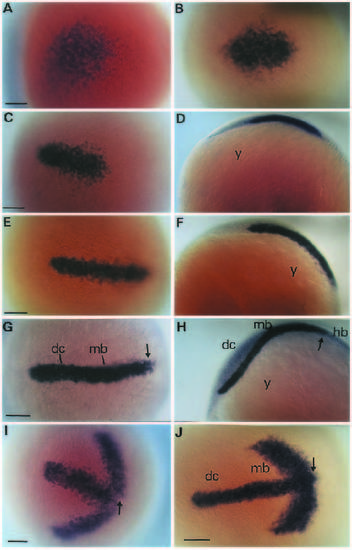
Expression of hlx-1 in the rostral region of zebrafish embryos during early stages of neurulation. Transcripts were localized by in situ hybridization on a series of whole-mount embryos at 9-10 hpf (A-H). Dorsal views of the rostral region (anterior to the left) of subsequent stages are shown in A,B,E and G. Side views of the same embryos as in C,E and G are shown in D,F and H, respectively. Some embryos were hybridized simultaneously with digoxigenin-labelled probes of both hlx-1 and the pax[b] gene (Krauss et al., 1991b). The double stained embryos shown in I and J are comparable to the stages presented in C and G, respectively. Arrows indicate the location of the presumptive midbrain-hindbrain boundary. Bar, 60 µm. Abbreviations: dc, diencephalon; hb, hindbrain; mb, midbrain; y, yolk. EXPRESSION / LABELING:
|
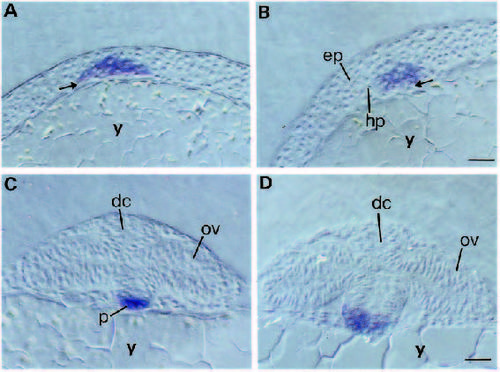
Analysis of the tissue distribution of hlx-1 transcripts in rostral cross-sections of stained embryos. Cross-sections near the posterior and anterior ends of the hlx-1 stripe in the same 9-10 hpf embryo are shown in A and B, respectively. Arrows indicate the location of a ventral layer of presumptive endodermal cells where transcripts are not detected. Cross-sections in the diencephalic region of 12 and 16 hpf embryos are shown in C and D, respectively. Bar, 30 µm. Abbreviations: dc, diencephalon; ep, epiblast; hp, hypoblast; ov, optic vesicle; p, polster; y, yolk. EXPRESSION / LABELING:
|
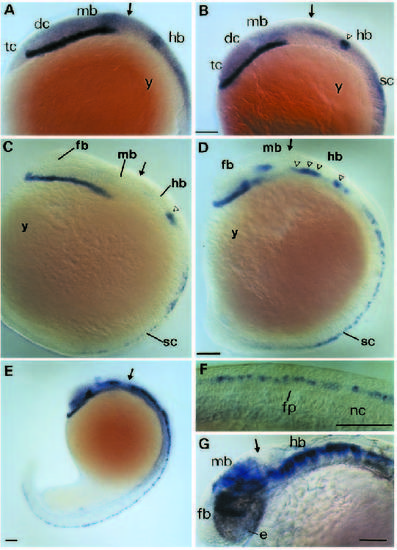
Whole-mount in situ hybridization analysis of hlx-1 expression of different developmental stages. Side views (anterior to the left) of 11, 12, 13, 16, 19 and 30 hpf are shown in A, B, C, D, E and G, respectively. The spinal cord of the 19 hpf embryo is shown at high magnification in F. Arrows indicate the location of the midbrain-hindbrain boundary and open triangles mark the position of rhombomere-restricted sites of expression in the hindbrain. Bar, 60 µm. Abbreviations: dc, diencephalon; e, eye; fb, forebrain; fp, floor plate; hb, hindbrain; mb, midbrain; nc, notochord; sc, spinal cord; tc, telencephalon; y, yolk. EXPRESSION / LABELING:
|
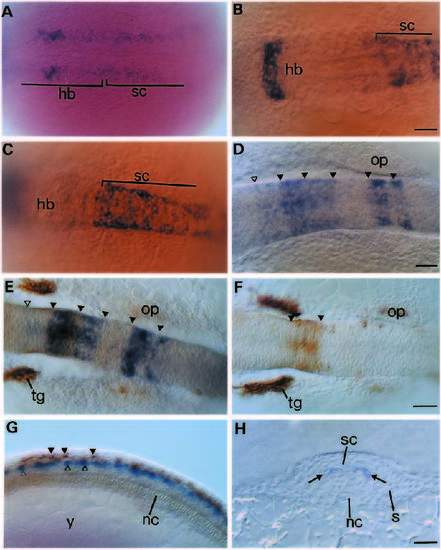
Analysis of hlx-1 expression during early stages of hindbrain and spinal cord development. Dorsal views of the posterior hindbrain region at 10- 11 hpf and 12 hpf are shown in A and B, repectively. Dorsal views of the anterior spinal cord region at 12 hpf (C) and 15 hpf (D). (E) Dorsal view of the hindbrain in a 15-16 hpf embryo double labelled with hlx-1 and the zn-12 antibody. (F) Dorsal view of the hindbrain of a 16 hpf embryo after immunohistochemical staining with the zn-12 antibody. The arrowheads in D, E and F indicate the approximate location of rhombomere borders. The open triangles in D and E mark the position of the anterior border of the first rhombomere (Ro1). (G) Side view of the spinal cord region of a 16 hpf embryo double labelled with hlx-1 and zn-12. Arrowheads and open triangles indicate the location of Rohon Beard neurons and hlx- 1-labelled cells, respectively. (H) Crosssection of the spinal cord at 16 hpf after whole-mount hlx-1 staining. Arrows indicate the dorsoventral location of columns of hlx-1-expressing cells. Bar, 30 µm. Abbreviations: hb, hindbrain; nc, notochord; op, otic placode; s, somite; sc, spinal cord; tg, trigeminal ganglia; y, yolk. EXPRESSION / LABELING:
|
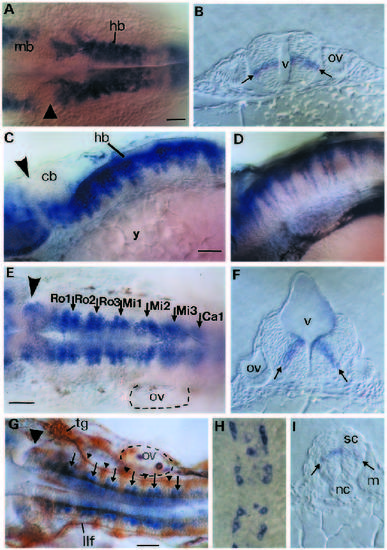
Analysis of hlx-1 expression during cell differentiation in the hindbrain and spinal cord. A and B show dorsal views and cross-sections of the hindbrain in a 22 hpf embryo, respectively. The arrows in picture B indicate the location of the bilateral columns of hlx-1- expressing cells. Large arrowheads in A,C,E and G indicate the location of the furrow at the midbrain-hindbrain border. C and D are side views of the hindbrain of hlx-1-stained 30 and 45 hpf embryos, respectively. E and F show dorsal view and cross-section of the hindbrain in 30 hpf embryos labelled with the hlx-1 probe. In E the location of the individual rhombomeres are shown and the predicted segment borders are indicated by arrows. The arrows in F mark the dorsoventral location of the transversal hlx-1 stripes. (G) Dorsal view of the hindbrain of a 30 hpf embryo double labelled with hlx-1 and zn-12. Arrowheads mark the position of segmentally arranged clusters of reticular neurons and arrows indicate the predicted rhombomere borders. H and I show dorsal view and cross-section of the anterior spinal cord in a 22 hpf embryo. The two arrows in I indicate the dorsoventral location of the bilateral columns of hlx-1-expressing cells. Bar, 30 µm. Abbreviations: cb, cerebellum; hb, hindbrain; llf, lateral longitudinal fascicle; m, myotome; mb, midbrain; nc, notochord; ov, otic vesicle; sc, spinal cord; tg, trigeminal ganglia; v, fourth ventricle; y, yolk; Ro1-Ca1, abbreviations for rhombomeres 1-7. EXPRESSION / LABELING:
|
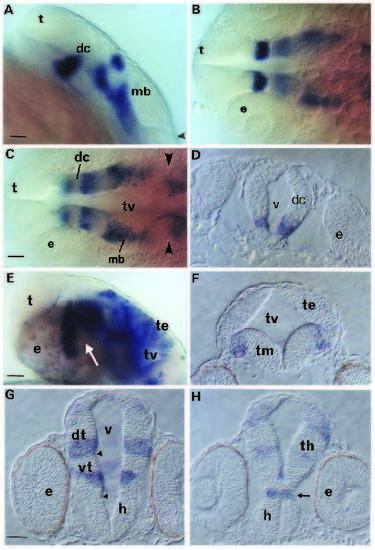
Analysis of hlx-1 expression in the rostral brain. (A-C) Side view and dorsal views at two different focal planes of the rostral brain in the same 22 hpf embryo, respectively. Arrowheads mark the position of the furrow at the midbrain-hindbrain border. (D) Cross-section in the diencephalic region at 22 hpf. (E) Side view of the rostral brain of a 30 hpf embryo. Cross-sections of the midbrain (F) and diencephalic region (G,H) of a 30 hpf embryo (G is most rostral). The arrows in E and H indicate the location of the ventral flexure. Arrowheads in G mark the positions of sulci. Bar, 30 µm. Abbreviations: dc, diencephalon; dt, dorsal thalamus; e, eye; h, hypothalamus; mb, midbrain; t, telencephalon; te, tectum; th, thalamus; tm, tegmentum; tv, tectal ventricle; v, ventricle; vt, ventral thalamus. EXPRESSION / LABELING:
|