
Fig. 5
- ID
- ZDB-FIG-141020-9
- Publication
- Fjose et al., 1994 - Expression of the zebrafish gene hlx-1 in the prechordal plate and during CNS development
- Other Figures
- All Figure Page
- Back to All Figure Page
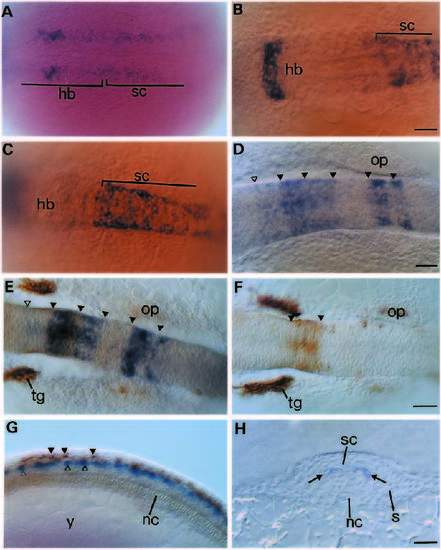
Analysis of hlx-1 expression during early stages of hindbrain and spinal cord development. Dorsal views of the posterior hindbrain region at 10- 11 hpf and 12 hpf are shown in A and B, repectively. Dorsal views of the anterior spinal cord region at 12 hpf (C) and 15 hpf (D). (E) Dorsal view of the hindbrain in a 15-16 hpf embryo double labelled with hlx-1 and the zn-12 antibody. (F) Dorsal view of the hindbrain of a 16 hpf embryo after immunohistochemical staining with the zn-12 antibody. The arrowheads in D, E and F indicate the approximate location of rhombomere borders. The open triangles in D and E mark the position of the anterior border of the first rhombomere (Ro1). (G) Side view of the spinal cord region of a 16 hpf embryo double labelled with hlx-1 and zn-12. Arrowheads and open triangles indicate the location of Rohon Beard neurons and hlx- 1-labelled cells, respectively. (H) Crosssection of the spinal cord at 16 hpf after whole-mount hlx-1 staining. Arrows indicate the dorsoventral location of columns of hlx-1-expressing cells. Bar, 30 µm. Abbreviations: hb, hindbrain; nc, notochord; op, otic placode; s, somite; sc, spinal cord; tg, trigeminal ganglia; y, yolk. |
| Gene: | |
|---|---|
| Antibody: | |
| Fish: | |
| Anatomical Terms: | |
| Stage Range: | 1-4 somites to 14-19 somites |