FIGURE SUMMARY
Title

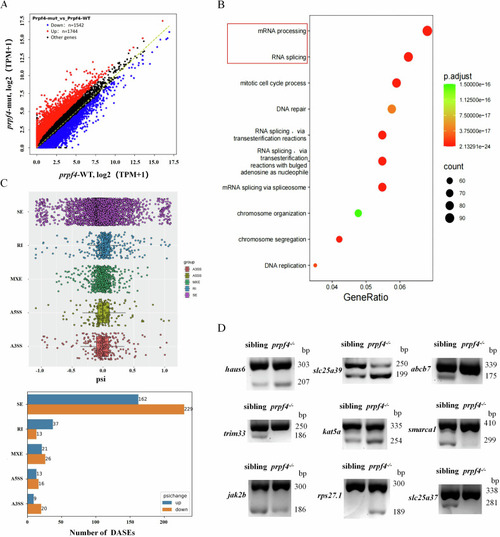
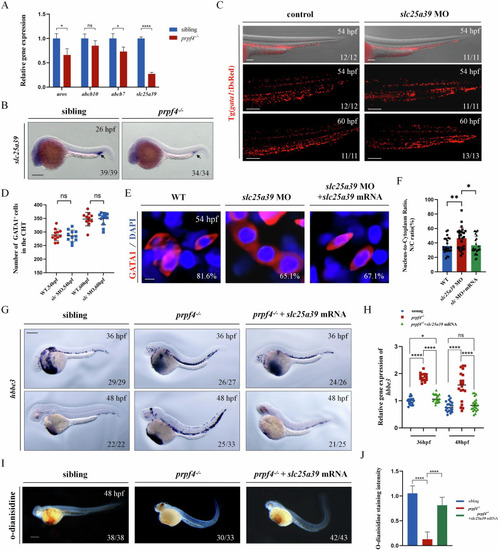
Prpf4 sequentially regulates the expansion and maturation of erythrocyte through distinct mechanisms

Authors
Deng, Z., Huang, S., Pei, Y., Li, H., Dong, Y., Li, Y., Ran, Q., Liu, X., Feng, Y., Wang, Q., Guo, Z., Huang, S.
Source
Full text @ Cell Death Discov

The prpf4 mutation disrupted erythropoiesis in zebrafish.

A, B Embryos with prpf4 deficiency exhibit abnormal morphology. A At 36 hpf, prpf4 mutants exhibited a slight tail curvature and a slightly paler coloration in the ventral yolk sac region (a1–a2’). The abnormal morphology of prpf4 mutants was rescued by the injection of prpf4 mRNA (a2–a3’). B At 60 hpf, prpf4 mutants exhibited bulging ventricle, paler coloration in the cardiac region, tail curvature, and a noticeably smaller head (b1–b2’). The injection of prpf4 mRNA effectively rescued the abnormal morphology of prpf4 mutants (b2–b3’). The white arrows indicate the ventral yolk sac region of the embryos. C, D Detection of hemoglobin levels in siblings and prpf4 mutants at 36 hpf and 48 hpf using o-dianisidine staining. E–M Analysis of erythroid and hematopoietic progenitor markers in prpf4−/− embryos. E WISH showing hbae1.1 expression in siblings and prpf4−/− embryos at 26 hpf. F WISH analysis of runx1 expression in siblings and prpf4−/− embryos at 26 hpf. G RT-qPCR analysis of dissected tail regions from 26 hpf embryos. Compared with siblings (set as 1), prpf4−/− embryos showed reduced hbae1.1 expression (0.68-fold), while runx1 expression remained unchanged. H WISH showing hbae1.1 expression in siblings and prpf4−/− embryos at 32 hpf. I WISH showing c-myb expression in siblings and prpf4−/− embryos at 32 hpf. J RT-qPCR analysis of dissected tail regions from 32 hpf embryos. Compared with siblings (set as 1), hbae1.1 expression was reduced in prpf4−/− embryos (0.59-fold), whereas c-myb expression showed no significant difference. K Confocal images of Tg(gata1:DsRed) embryos at 32 hpf showing erythroid cells in the CHT region. L Quantification of Gata1⁺ cells in the CHT revealed a significant reduction in prpf4−/− embryos compared with siblings. M Confocal images of Tg(c-myb:GFP) embryos at 32 hpf showing HSPCs in the AGM region. N Quantification of C-myb⁺ HSPCs in the AGM showed no significant difference between prpf4−/− embryos and siblings. O WISH showing hbae1.1 expression in siblings and prpf4−/− embryos at 48 hpf. P WISH showing c-myb expression in siblings and prpf4−/− embryos at 48 hpf. Q RT-qPCR analysis of dissected tail regions from 48 hpf embryos. prpf4−/− embryos exhibited decreased hbae1.1 expression (0.43-fold compared with siblings set as 1), while c-myb expression was reduced to 0.89-fold relative to siblings. R WISH showing hbbe3 expression patterns in prpf4 mutants and siblings at 48 hpf. Scale bars: 200 μm unless otherwise indicated; 100 μm in (K, M).

prpf4 deficiency reduces the number of erythrocytes in zebrafish.

A, B The number of erythrocytes in the CHT region of siblings and prpf4−/− embryos was assessed using confocal microscopy in Tg(gata1:DsRed) transgenic zebrafish. Scale bar: 100 µm. C, D FACS analysis of GATA1+ erythrocytes from siblings and prpf4−/− mutants at 48 hpf. C In prpf4 mutants, the proportion of GATA1+ erythrocytes was reduced (30 embryos per group). D Quantitative analysis of GATA1+ erythrocyte numbers in individual embryos. E Cell cycle analysis of GATA1+ erythrocytes from siblings and prpf4−/− mutants at 48 hpf (30 embryos per group). F Quantification of the percentage of cells in each cell cycle phase. G, H Confocal microscopy analysis of apoptosis in GATA1+ erythrocytes in the CHT region of siblings and prpf4−/− embryos at 54 hpf. G Immunofluorescence staining showing GATA1 (red), active Caspase-3 (green), and DAPI (blue). Arrows indicate apoptotic GATA1+ cells. Scale bar: 50 µm. H Quantitative analysis shows a significantly higher proportion of apoptotic GATA1+ cells in the CHT region of prpf4−/− embryos compared with siblings.

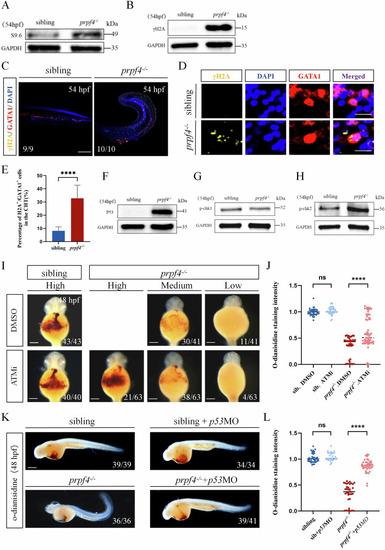
Activating of the DDR-ATM/Chk2-p53 signaling pathway disrupts erythropoiesis in prpf4 mutants.

A, B Western blot analysis for RNA:DNA hybrid accumulation and DNA damage in 54 hpf embryos. A S9.6 antibody detected higher RNA:DNA hybrid levels in prpf4−/− embryos than in siblings. B γH2AX levels are significantly increased in prpf4−/− embryos compared with siblings. C–E Analysis of DNA damage in GATA1+ erythrocytes in 54 hpf embryos. C Confocal images show γH2AX staining in the CHT region of siblings and prpf4−/− embryos. Scale bar: 200 µm. D High-magnification images of erythrocytes show the colocalization of γH2AX and GATA1. Scale bar: 50 µm. E Quantification of the percentage of γH2AX-positive cells among GATA1+ cells in the CHT region. F-H Western blot analysis of the activation of P53 and checkpoint kinase signaling in 54 hpf embryos. F Increased P53 protein levels are observed in prpf4−/− embryos compared with siblings. G p-Chk1 protein levels show no significant changes between prpf4−/− embryos and siblings. H p-Chk2 protein levels are increased in prpf4−/− embryos compared with siblings. I, J Effect of the specific kinase inhibitor ATMi (KU60019) on erythrocyte hemoglobin levels in prpf4−/− embryos at 48 hpf. I O-dianisidine staining intensity in DMSO-treated siblings, prpf4−/− embryos, and ATMi-treated prpf4−/− embryos. Scale bar: 100 µm. J Quantitative analysis of o-dianisidine staining intensity. ATMi-treated prpf4−/− embryos show significantly higher staining intensity compared to DMSO-treated prpf4−/− embryos. K, L Effect of p53 knockdown on erythrocyte hemoglobin levels in prpf4−/− embryos at 48 hpf. K Knockdown of p53 in prpf4−/− embryos significantly increased hemoglobin levels, as indicated by stronger o-dianisidine staining. Scale bar: 200 µm. L Quantitative analysis of o-dianisidine staining intensity.

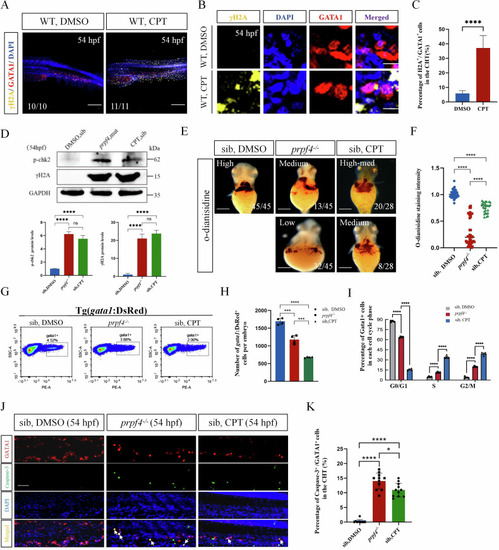
DNA damage-induced ATM/Chk2-p53 pathway partially mediates erythrocyte defects in prpf4 mutants.

A-C DNA damage examination in erythrocytes in the CHT region at 54 hpf. A Confocal images showing γH2AX (yellow) staining in WT (DMSO) and WT embryos treated with camptothecin. Scale bar: 200 µm. B High-magnification images of γH2AX and GATA1 colocalization in erythrocytes. Scale bar: 50 µm. C Quantitative analysis of γH2AX-positive cells among GATA1-positive cells in the CHT region. D Western blot analysis of p-Chk2 and γH2AX levels in 54 hpf embryos. Densitometric quantification of p-Chk2 and γH2AX protein levels is shown below. E, F Hemoglobin levels in 60 hpf embryos assessed by o-dianisidine staining. E Hemoglobin staining intensity in siblings treated with DMSO, prpf4−/− embryos, and camptothecin-treated siblings. Staining intensity is categorized as high, medium, or low. Scale bar: 100 µm. F Quantitative analysis of o-dianisidine staining intensity. G–I FACS analysis of GATA1+ erythrocytes in Tg(gata1:DsRed) embryos at 54 hpf. G The percentage of GATA1+ cells in DMSO-treated siblings, prpf4−/− embryos, and camptothecin-treated siblings (30 embryos per group). H Quantification of the total number of GATA1+ cells per embryo. I Cell cycle distribution of GATA1+ cells. Prpf4−/− embryos and camptothecin-treated siblings exhibit cell cycle arrest. J, K Detection of apoptosis in GATA1+ erythrocytes in the CHT region of 54 hpf embryos. J Confocal microscopy images showing active Caspase-3 staining in DMSO-treated siblings, prpf4−/− embryos, and camptothecin-treated siblings. Merged images highlight apoptotic signals (arrows) in GATA1+ cells. Scale bar: 50 µm. K Quantification of the percentage of active Caspase-3+ cells among GATA1+ cells in the CHT region. Both prpf4−/− embryos and camptothecin-treated siblings show a significant increase in apoptosis compared with DMSO-treated siblings.

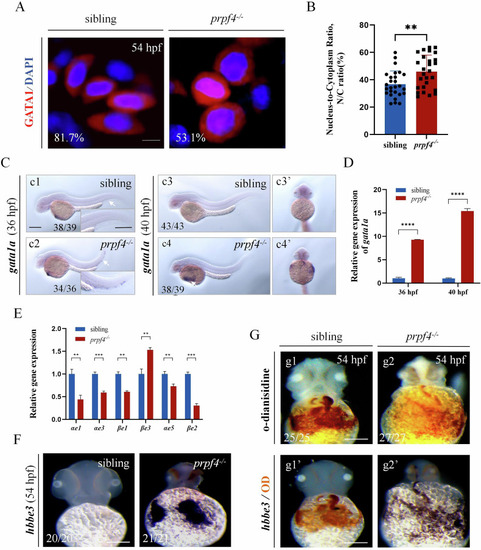
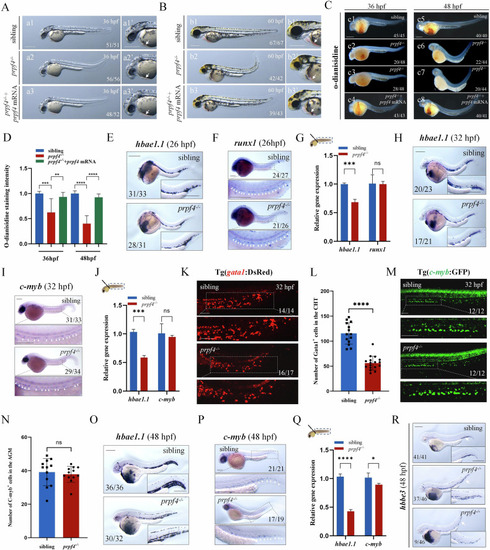
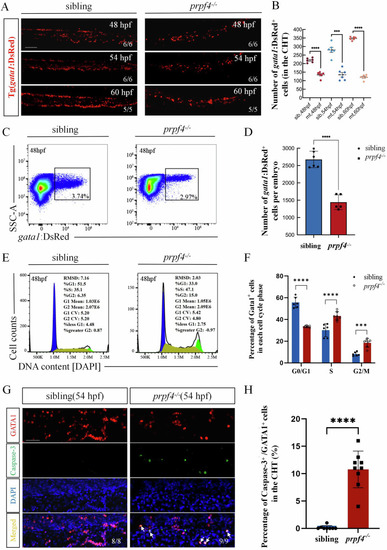
The maturation of erythrocytes is disturbed in prpf4 mutants.

A, B Morphological analysis of erythrocytes in siblings and prpf4−/− embryos at 54 hpf. A Representative confocal images showing GATA1+ cells stained with DAPI in siblings and prpf4−/− embryos. In sibling embryos, 81.7% of erythrocytes exhibit an oval morphology, while in prpf4−/− embryos, 53.1% of erythrocytes display a round morphology. The presented images represent typical erythrocyte morphologies observed in each group. Scale bar: 20 µm. B Quantification of the nuclear-to-cytoplasmic (N/C) ratio of individual GATA1+ cells (30 embryos per group). C WISH analysis of gata1a expression in siblings and prpf4−/− embryos at 36 hpf and 40 hpf. Lateral views (c3, c4) and ventral views (c3’, c4’). Scale bar: 200 µm. D Relative expression of gata1a in prpf4−/− mutants and siblings at 36 hpf and 40 hpf, as determined by RT-qPCR. E RT-qPCR analysis of erythroid-related gene expression in siblings and prpf4−/− embryos. F WISH analysis of hbbe3 expression in siblings and prpf4−/− embryos at 54 hpf. G Combined analysis of hbbe3 expression and hemoglobin levels in embryos. g1, g2 O-dianisidine staining reveals reduced hemoglobin levels in prpf4−/− embryos compared to siblings. g1′, g2′ Whole-mount in situ hybridization for hbbe3 performed on the same embryos as in (g1) and (g2). Scale bars: 100 µm (F,G).

prpf4 deficiency leads to aberrant splicing of genes related to erythrocyte differentiation and maturation.

A RNA-seq analysis reveals significant differential gene expression in prpf4−/− mutants compared to siblings. Differentially expressed genes were identified using a fold-change threshold and adjusted p-value. B Gene Ontology (GO) enrichment analysis of upregulated genes in prpf4−/− mutants. C Differential alternative splicing events (DASEs) in prpf4−/− mutants. PSI (Percent Spliced-In) indicates the proportion of transcripts including a given exon; changes in PSI reflect shifts in splicing patterns. Splicing events with FDR < 0.05 and |ΔPSI | ≥ 0.1 were considered significant. Top: Scatter plot of PSI (Percent Spliced-In) changes for different types of splicing events, including skipped exon (SE), retained intron (RI), mutually exclusive exon (MXE), alternative 5’ splice site (A5SS), and alternative 3’ splice site (A3SS). SE events are the most affected, with a predominance of negative PSI changes. Bottom: Bar plot showing the number of upregulated and downregulated DASEs for each splicing event type. The majority of DASEs are SE events, with 229 downregulated and 162 upregulated cases. D Validation of aberrant splicing events in erythropoiesis-related genes by SqRT-PCR at 48 hpf. Differential splicing patterns were confirmed in prpf4−/− embryos for representative genes including haus6, slc25a39, abcb7, trim33, kat5a, smarca1, jak2b, rps27.1, and slc25a37.

slc25a39 downregulation in prpf4 mutants blocks erythrocyte maturation.

A RT-qPCR analysis of gene expression in GATA1+ erythrocytes at 48 hpf. B Expression of slc25a39 in siblings and prpf4−/− embryos at 26 hpf, detected by in situ hybridization. Scale bar: 200 µm. C, D Effect of slc25a39 knockdown on GATA1+ erythrocytes in Tg(gata1:DsRed) embryos. C Confocal images showing GATA1+ cells in the CHT region of control and slc25a39 MO-injected embryos at 54 hpf and 60 hpf. Scale bar: 100 µm. D Quantification of the number of GATA1+ cells in the CHT region. E, F Effect of slc25a39 knockdown on erythrocytes morphology in Tg(gata1:DsRed) embryos at 54 hpf. E Confocal images showing the morphology of GATA1+ cells in control, slc25a39 MO-injected, and slc25a39 MO + mRNA co-injected embryos. Scale bar: 20 µm. F Quantitative analysis of the nuclear-to-cytoplasmic (N/C) ratio of individual cells measured from (E). WT (n = 25), slc25a39 MO (n = 27), slc25a39 MO + mRNA (n = 24). G WISH analysis of hbbe3 at 36 hpf shows the staining patterns in sibling, prpf4−/−, and prpf4−/− embryos co-injected with slc25a39 mRNA. Scale bar: 200 µm. H Quantification of hbbe3 staining intensity in the CHT region at 36 hpf reveals significantly higher staining intensity in prpf4−/− embryos compared with sibling embryos. Co-injection of slc25a39 mRNA significantly reduces the staining intensity in prpf4−/− embryos. I, J Effect of slc25a39 mRNA injection on hemoglobin levels in prpf4−/− embryos at 48 hpf. I Images of o-dianisidine staining in WT, prpf4−/−, and prpf4−/− embryos injected with slc25a39 mRNA. Scale bar: 200 µm. J Quantification of o-dianisidine staining intensity. Hemoglobin levels are significantly reduced in prpf4−/− embryos compared with WT, while slc25a39 mRNA injection partially restores hemoglobin levels in prpf4−/− embryos. Scale bar: 100 µm.

Acknowledgments
This image is the copyrighted work of the attributed author or publisher, and ZFIN has permission only to display this image to its users. Additional permissions should be obtained from the applicable author or publisher of the image. Full text @ Cell Death Discov