
- Title
-
Tulp3 deficiency results in ciliopathy phenotypes during zebrafish embryogenesis
- Authors
- Epting, D., Devane, J., Mertes, R., Kayser, S., Helmstädter, M., Metzger, P., Boerries, M., Bergmann, C., Ott, E.
- Source
- Full text @ Sci. Rep.
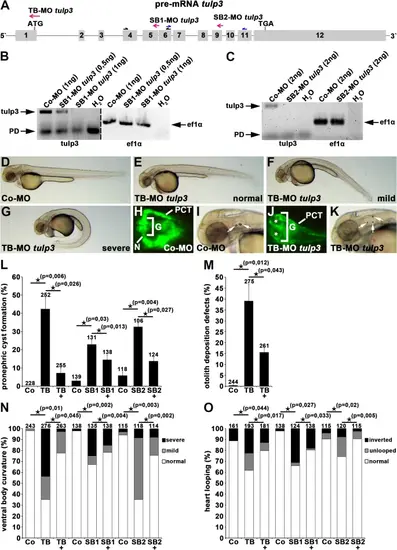
Tulp3 knockdown analyses of cilia-related phenotypes during zebrafish embryogenesis. (A) Exon-intron structure (drawn to scale) of tulp3 in zebrafish (Ensembl Transcript ID: ENSDART00000093236.6). Translation start codon (ATG), termination codon (TGA), TB-MO tulp3, SB1-MO tulp3 and SB2-MO tulp3 are indicated. Black and blue half arrows indicate primer pairs used for analysis of SB1-MO tulp3 and SB2-MO tulp3 efficiency, respectively. (B, C) Expression analysis of tulp3 using semi-quantitative RT-PCR on cDNA of Co-MO (1ng) or SB1-MO tulp3 (0,5 or 1ng) injected embryos (B) and Co-MO (2ng) or SB2-MO tulp3 (2ng) injected embryos, respectively (C); while an exon exclusion is not detectable upon injection of SB1-MO tulp3 or SB2-MO tulp3, respectively, the highly reduced wildtype PCR products compared to the control indicate an (partial) intron insertion through cryptic splice site activation that might not be detectable by utilized PCR conditions. Black arrows point to tulp3 and ef1α PCR products, respectively; Primer dimer (PD). H2O served as negative control and ef1α as loading control; dividing lines in (B) indicate different contrast from different parts of the same gel image. (D-G) Bright-field images of zebrafish embryos at 2dpf injected with Co-MO (2ng) (D) or TB-MO tulp3 (2ng) (E-G). In comparison to Co-MO injected embryos, injection of TB-MO tulp3 leads to different degrees of ventral body curvature. (H–K) Knockdown of Tulp3 leads to pronephric cyst formation (white stars in (J)) and otolith deposition defects (white arrows in (K)) at 2dpf as shown in a dorsal view with anterior to the left of a TB-MO tulp3 (2ng) injected li1Tg embryo (J), and an embryo shown in a bright-field image (K), respectively, in comparison to Co-MO (2ng) injected embryos (H, I); expression of EGFP fluorescence labels glomerulus (G), neck (N) and proximal convoluted tubule (PCT). (L) Quantification of pronephric cyst formation in 2dpf zebrafish embryos injected with Co-MO (2ng) (4 independent experiments; n = 31, n = 63, n = 52 and n = 82 analysed embryos, respectively), TB-MO tulp3 (2ng) (n = 35, n = 79, n = 57 and n = 81), TB-MO tulp3 (2ng) + HTULP3 mRNA (5pg) (n = 54, n = 71, n = 57 and n = 73) or Co-MO (0,5 ng) (3 independent experiments; n = 46, n = 46 and n = 47), SB1-MO tulp3 (0,5 ng) (n = 41, n = 44 and n = 46), SB1-MO tulp3 (0,5 ng) + HTULP3 mRNA (5pg) (n = 46, n = 46 and n = 46) or Co-MO (2ng) (3 independent experiments; n = 42, n = 39 and n = 37), SB2-MO tulp3 (2ng) (n = 31, n = 37 and n = 38), SB2-MO tulp3 (2ng) + HTULP3 mRNA (5pg) (n = 41, n = 41 and n = 42). (M) Quantification of otolith deposition defects in 2dpf zebrafish embryos injected with Co-MO (2ng) (4 independent experiments; n = 42, n = 70, n = 50 and n = 82 analysed embryos, respectively), TB-MO tulp3 (2ng) (n = 44, n = 79, n = 71 and n = 81), TB-MO tulp3 (2ng) + HTULP3 mRNA (5pg) (n = 56, n = 71, n = 56 and n = 78). (N) Quantification of ventral body curvature in 2dpf zebrafish embryos injected with Co-MO (2ng) (4 independent experiments; n = 41, n = 70, n = 50 and n = 82 analysed embryos, respectively), TB-MO tulp3 (2ng) (n = 40, n = 80, n = 72 and n = 84), TB-MO tulp3 (2ng) + HTULP3 mRNA (5pg) (n = 57, n = 71, n = 56 and n = 79) or Co-MO (0,5ng) (3 independent experiments; n = 46, n = 46 and n = 46), SB1-MO tulp3 (0,5ng) (n = 43, n = 46 and n = 46), SB1-MO tulp3 (0,5ng) + HTULP3 mRNA (5pg) (n = 46, n = 46 and n = 46) or Co-MO (2ng) (3 independent experiments; n = 42, n = 39 and n = 34), SB2-MO tulp3 (2ng) (n = 42, n = 40 and n = 36), SB2-MO tulp3 (2ng) + HTULP3 mRNA (5pg) (n = 38, n = 40 and n = 36). (O) Quantification of altered heart looping in 2dpf zebrafish embryos injected with Co-MO (2ng) (3 independent experiments; n = 41, n = 70 and n = 50 analysed embryos, respectively), TB-MO tulp3 (2ng) (n = 43, n = 79 and n = 71), TB-MO tulp3 (2ng) + HTULP3 mRNA (5pg) (n = 56, n = 70 and n = 55) or Co-MO (0,5ng) (3 independent experiments; n = 46, n = 46 and n = 46), SB1-MO tulp3 (0,5ng) (n = 43, n = 35 and n = 46), SB1-MO tulp3 (0,5ng) + HTULP3 mRNA (5pg) (n = 46, n = 46 and n = 46) or Co-MO (2ng) (3 independent experiments; n = 42, n = 39 and n = 34), SB2-MO tulp3 (2ng) (n = 41, n = 39 and n = 40), SB2-MO tulp3 (2ng) + HTULP3 mRNA (5pg) (n = 39, n = 40 and n = 36); total number of embryos used for analyses are shown above respective bar. Unprocessed gel images (B and C, respectively) are presented in Suppl. Figure 7. |
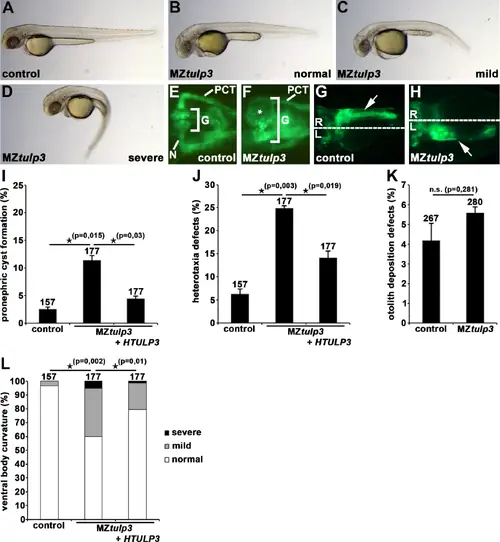
Tulp3 knockout analyses of cilia-related phenotypes during zebrafish embryogenesis. (A-D) Bright-field images of MZtulp3 embryos (B-D) and respective control embryo (A) at 2dpf. In comparison to the control embryos, MZtulp3 embryos display different degrees of ventral body curvature. (E–K) Knockout of Tulp3 leads to pronephric cyst formation (white star in (F)) and altered positioning of the exocrine pancreas (white arrow in (H)) at 2dpf as shown in a dorsal view with anterior to the left of a MZtulp3; li1Tg embryo, respectively, in comparison to control embryos (E, G); expression of EGFP fluorescence labels glomerulus (G), neck (N), proximal convoluted tubule (PCT) and exocrine pancreas. (I) Quantification of pronephric cyst formation in control embryos (3 independent experiments; n = 39, n = 59 and n = 59 analysed embryos, respectively), MZtulp3 embryos (n = 59, n = 59 and n = 59) and MZtulp3 embryos + HTULP3 (n = 59, n = 59 and n = 59) at 2dpf. (J) Quantification of altered positioning of the exocrine pancreas in control embryos (3 independent experiments; n = 39, n = 59 and n = 59 analysed embryos, respectively), MZtulp3 embryos (n = 59, n = 59 and n = 59) and MZtulp3 embryos + HTULP3 (n = 59, n = 59 and n = 59) at 2dpf. (K) Quantification of otolith deposition defects in control embryos (3 independent experiments; n = 101, n = 83 and n = 83 analysed embryos, respectively) and MZtulp3 embryos (n = 76, n = 92 and n = 112) at 2dpf. (L) Quantification of ventral body curvature in control embryos (3 independent experiments; n = 39, n = 59 and n = 59 analysed embryos, respectively), MZtulp3 embryos (n = 59, n = 59 and n = 59) and MZtulp3 embryos + HTULP3 (n = 59, n = 59 and n = 59) at 2dpf; total number of embryos used for analyses are shown above respective bar. PHENOTYPE:
|
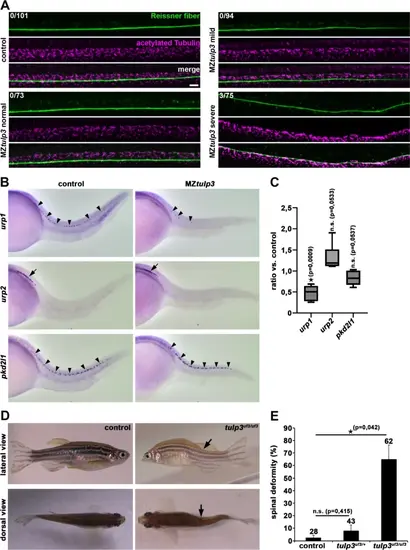
Tulp3 knockout results in decrease of urp1 expression and scoliosis during zebrafish development. (A) Representative confocal images of MZtulp3 embryos (without curvature phenotype (normal), mild and severe ventral body curvature) and respective control embryos at 2dpf immunostained with anti-RF and anti-acetylated Tubulin as a ciliary marker. Loss of Tulp3 results in no obvious defects in RF formation compared to the control. Numbers represent embryos displaying RF disorganization and embryos that have been analysed in total from 3 independent experiments (control: n = 33, n = 42 and n = 26; MZtulp3 (normal): n = 11, n = 38 and n = 24; MZtulp3 (mild): n = 30, n = 28 and n = 36; MZtulp3 (severe): n = 22, n = 28 and n = 25). Scale bar: 10 μm. (B) WISH analysis reveals reduced urp1 expression in ventral CSF-cNs (black arrowheads) of MZtulp3 embryos (presenting with a ventral curvature phenotype) compared to the control at 28hpf. Expression levels of urp2 (black arrow) and pkd2l1 (black arrowheads; serves as a control as its expression in CSF-cNs has been shown to be unaffected in ciliary mutants42,47) are comparable between MZtulp3 and control embryos at 28hpf. (C) qPCR analysis reveals unaltered expression of urp2 and pkd2l1 while urp1 expression was significantly reduced in MZtulp3 embryos compared to the respective control at 2dpf. (D, E) Representative images (lateral and dorsal views) and quantification of adult (18 months) tulp3 mutant zebrafish displaying scoliosis phenotypes (black arrows) in comparison to the respective control analysed from 3 independent breedings (control: n = 15, n = 13 and n = 0; heterozygous tulp3 mutant: n = 29, n = 6 and n = 8; homozygous tulp3: n = 15, n = 40 and n = 7); total number of adult fish used for analyses are shown above respective bar. |
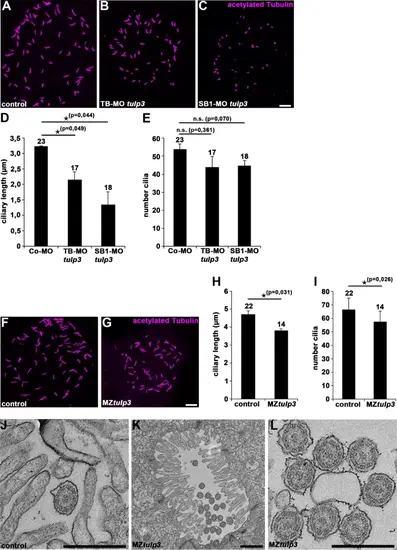
Tulp3 deficiency results in defective cilia formation and function in zebrafish. (A-C) Representative confocal images of the Kupffer’s vesicle of Co-MO (2ng) (A), TB-MO tulp3 (2ng) (B) or SB1-MO tulp3 (0,5ng) (C) injected embryos at 8 somites immunostained with anti-acetylated Tubulin as a ciliary marker. Scale bar: 10 μm. (D, E) Quantification of the ciliary length (D) and cilia number (E) in the Kupffer’s vesicle of Co-MO (3 independent experiments; n = 9, n = 7 and n = 7 analysed embryos, respectively), TB-MO tulp3 (n = 6, n = 4 and n = 7) or SB1-MO tulp3 (n = 4, n = 6 and n = 8) injected embryos at 8 somites; total number of embryos used for analyses are shown above respective bar. (F, G) Representative confocal images of the Kupffer’s vesicle of MZtulp3 embryo (G) and respective control embryo (F) at 8 somites immunostained with anti-acetylated Tubulin. Scale bar: 10 μm. (H, I) Quantification of the ciliary length (H) and cilia number (I) in the Kupffer’s vesicle of control embryos (3 independent experiments; n = 7, n = 7 and n = 8 analysed embryos, respectively) and MZtulp3 embryos (n = 6, n = 4 and n = 4) at 8 somites; total number of embryos used for analyses are shown above respective bar. (J-L) TEM of pronephric tubule microvilli and motile cilia of control embryos (J) and MZtulp3 (K, L) embryos (with severe ventral body curvature) at 5dpf. Scale bars: 500 nm (J, L); 1 μm (K). PHENOTYPE:
|
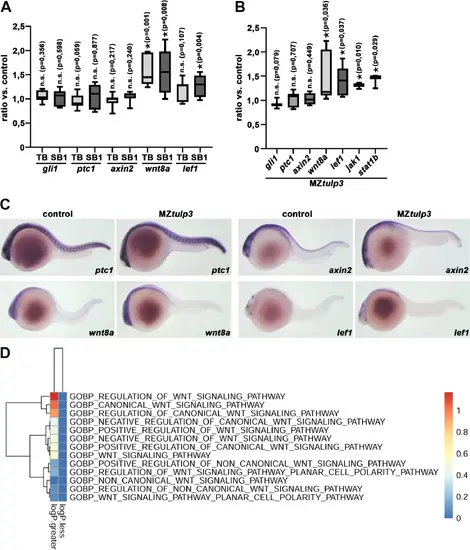
Tulp3 deficiency results in the upregulation of cilia-dependent signalling pathway components in zebrafish. (A) qPCR analysis reveals unaltered expression of Hh signalling components (gli1, ptc1) and Wnt signalling component axin2 while Wnt signalling components wnt8a and lef1 were upregulated upon TB/SB1-MO tulp3 mediated knockdown compared to the respective control at 1dpf. (B) qPCR analysis reveals unaltered expression of Hh signalling components (gli1, ptc1) and Wnt signalling component axin2 while Wnt signalling components wnt8a and lef1 or Jak/Stat signalling components jak1 and stat1b were upregulated in MZtulp3 embryos compared to the respective control at 1dpf. (C) WISH analyses indicate unaltered expression of Hh signalling component ptc1 and Wnt signalling component axin2 while Wnt signalling components wnt8a and lef1 were upregulated in MZtulp3 embryos compared to the respective control at 1dpf. (D) Heatmap of Wnt signalling pathway associated gene ontology (GO)-terms (biological process, BP) of MZtulp3 embryos compared to control embryos at 2dpf. Columns represent up- or downregulated processes in MZtulp3 mutant embryos compared to controls. |
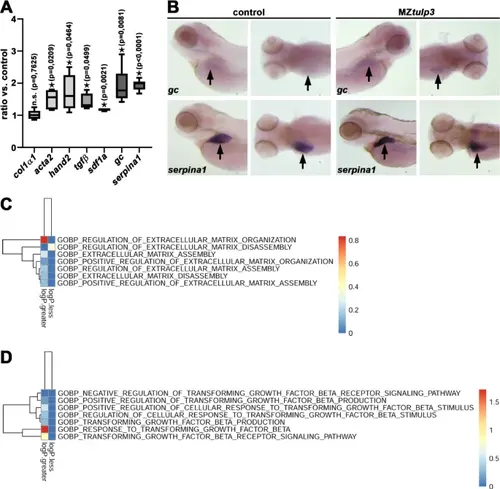
Loss of Tulp3 results in the upregulation of genes related to fibrosis during zebrafish embryogenesis. (A) qPCR analysis reveals unaltered expression of col1α1 while genes related to liver-fibrosis (acta2, hand2), inflammatory/damage (tgfβ, sdf1a) and liver function (gc, serpina1) were significantly upregulated in MZtulp3 embryos compared to the respective control at 4dpf. (B) WISH analyses indicate upregulated expression of gc and serpina1 in the liver (black arrow) in MZtulp3 embryos compared to the respective control at 4dpf (for each condition a lateral and dorsal view is shown). (C, D) Heatmaps of ECM organization (C) and Tgfβ signalling pathway (D) indicate an increase in related biological processes (GOBP) in MZtulp3 mutant compared to control embryos at 2dpf. Shown are respective up- or downregulated BPs. |