
- Title
-
Rapid generation of a sdhb loss-of-function zebrafish model for secreting pheochromocytomas and paragangliomas
- Authors
- Parisien-La Salle, S., Nobilleau, F., da Silva Babinet, A., Lamontagne, J., Labrecque, M., Rampal, B., Mas, C., Liao, M., Barragan Torres, V.A., Corbeil, G., Chatel-Chaix, L., Dona, M., Tétreault, M., Bourdeau, I., Samarut, É.
- Source
- Full text @ NPJ Genom Med
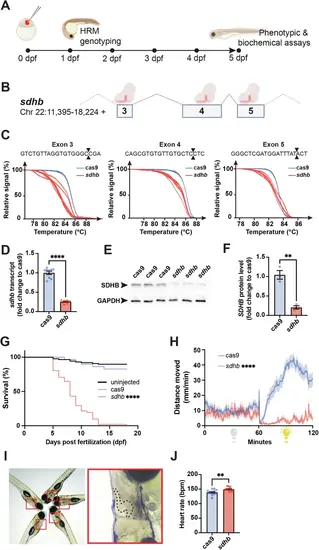
F0-injected sdhb-CRISPant zebrafish larvae display SDHB-associated phenotypes. A Timeline representation of our CRISPant approach starting with the microinjection of a gene-specific (i.e., sdhb) CRISPR/Cas9 mix in single-cell embryos, followed by High-Resolution Melting (HRM) genotyping from 1-day post-fertilization (dpf). Phenotypic and biochemical readouts can be acquired only few days following injection. B The genetic landscape of the zebrafish sdhb gene encompassing targeted exons 3, 4 and 5. C The mutagenic power of the injected CRISPR/Cas9 mix is validated by HRM comparing Cas9-injected embryos as controls in which only mRNA encoding CAS9 was microinjected (no gene-specific guide RNAs). D, E, F The level of sdhb expression is reduced in sdhb CRISPants both at the transcriptomic and protein levels as assessed by qRT-PCR (D) and western blot (E, F). (G) Survival of sdhb CRISPants (n = 51) is compared to Cas9-injected controls (n = 29) and uninjected larvae (n = 87) over 18 days. H The distance swam, binned per 30 s, is recorded for sdhb CRISPants (n = 32) and Cas9-injected controls (n = 32) during 60 min dark and 60 min light periods. I, J Representative setup and results of heart rate quantification in 5 dpf larvae (sdhb CRISPants, n = 13; Cas9-injected, n = 12). I Left: larvae mounted laterally in 3% methylcellulose for simultaneous video acquisition (~5 larvae per trial). Red boxes indicate individual larvae analyzed. Right: magnified view of one larva with the heart region outlined (dashed line), corresponding to the area used for automatic beat detection by DanioScope™ software. No anesthetic was used during acquisition. J Heart rate was quantified and compared using an unpaired t-test with two-tailed p-value calculation: ** p-value < 0.01; **** p-value < 0.0001. Icons in (A) and (B) are created in BioRender. Samarut, E. (2025) |
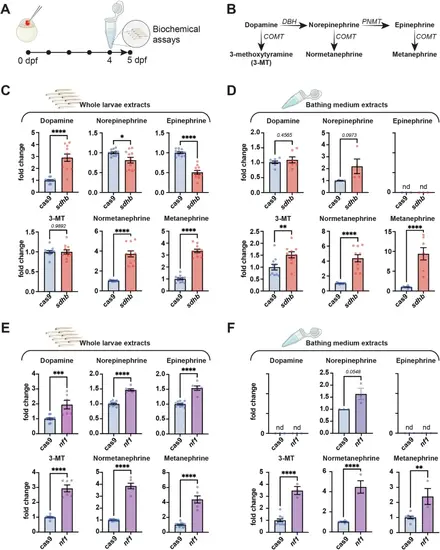
Catecholamine and metanephrine levels are affected in PPGL CRISPant zebrafish models. A Individual embryos are microinjected at the one-cell stage and larvae are pooled at 4 dpf overnight. Catecholamines and metanephrines levels were assessed on day 5 from whole larvae lysates and bathing medium. B Metabolic path of catecholamines and metanephrine synthesis. Enzymes are italicized (DBH: Dopamine beta-hydroxylase, PNMT: Phenylethanolamine N-Methyltransferase, COMT: Catechol-O-methyltransferase). C,D Catecholamines and metanephrines levels in sdhb CRISPants (n ≥ 6 pools of 10 larvae) compared to Cas9-injected controls (n ≥ 6 pools of 10 larvae) (whole larvae, (C) and bathing medium (D)). E,F Catecholamines and metanephrines levels in nf1 CRISPants (whole larvae, (E) and bathing medium (F). Of note, the levels of NE were below the detection limit in Cas9-control samples, and a subjective basal value was used to calculate the NE fold-change increase in nf1-CRISPant larvae. Unpaired t-test with two-tailed p-value calculation: * p-value < 0.05; ** p-value < 0.01; *** p-value < 0.001; **** p-value < 0.0001. Icons are created in BioRender. Samarut, E. (2025) https://BioRender.com/xk8wiuf. PHENOTYPE:
|
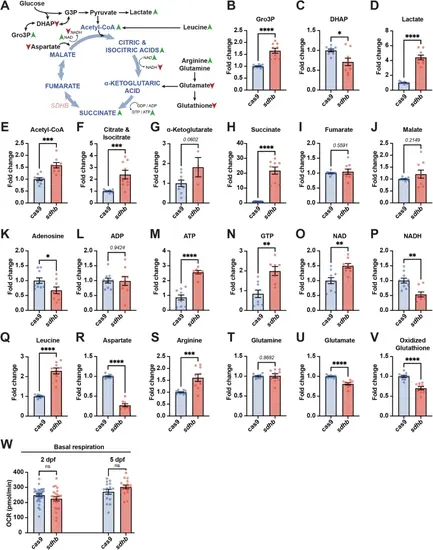
sdhb CRISPants depict broad metabolic pertubations. A Schematic of Krebs cycle intermediates (in blue) and other metabolites from related pathways (in black) which have been assayed from whole 5 dpf larvae lysates. The changes observed in sdhb CRISPants are indicated with arrowheads (green: increase; red: reduction). B–V Individual metabolite quantified from whole sdhb-CRISPant larvae (pools of 10; n = 9 pools of 10) to Cas9-injected control larvae (n = 10 pools of 10). W Oxygen consumption rate (OCR) was measured in whole Cas9-injected control and sdhb-CRISPant larvae at 2 and 5 days post-fertilization (dpf) using a Seahorse XFe96 analyzer. Unpaired t-test with two-tailed p-value calculation: * p-value < 0.05; ** p-value < 0.01; *** p-value < 0.001; **** p-value < 0.0001. PHENOTYPE:
|
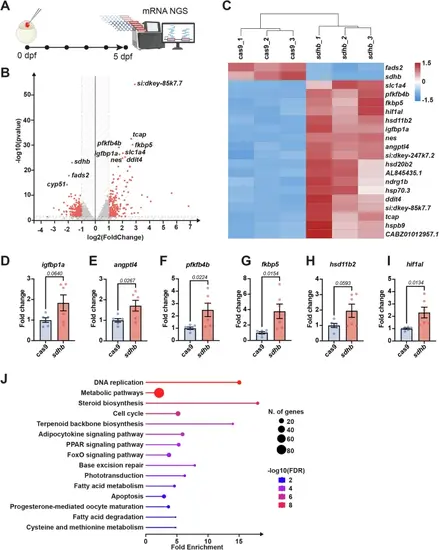
Transcriptomic changes in sdhb CRISPants.A Experimental timeline from one-cell stage embryo microinjection to whole larvae mRNA extraction at 5 dpf for RNA-sequencing. B Volcano plot with differentially expressed genes (DEGs) in red (filtered with a value < 0.05 and an absolute log2FoldChange > 1). The full list of DEGs is available in Supplementary Data 1. C Heatmap representing the top 20 DEGs between sdhb-CRISPant samples (sdhb_1, sdhb_2, sdhb_3) and Cas9 controls (cas9_1, cas9_2, cas9_3). D–I qRT-PCR validation of changes in the expression of relevant genes between sdhb-CRISPant (n = 6 pools of 10 larvae) and Cas9-injected control (n = 6 pools of 10 larvae) at 5 dpf. J Lollipop plot of top 15 significantly enriched KEGG pathways clustered from sdhb vs cas9 DEGs. The complete list of enriched KEGG pathways is available in Supplementary Data 2. Icons in panel A are created in BioRender. Samarut, E. (2025) https://BioRender.com/xk8wiuf. |

ZFIN is incorporating published figure images and captions as part of an ongoing project. Figures from some publications have not yet been curated, or are not available for display because of copyright restrictions. |