
|
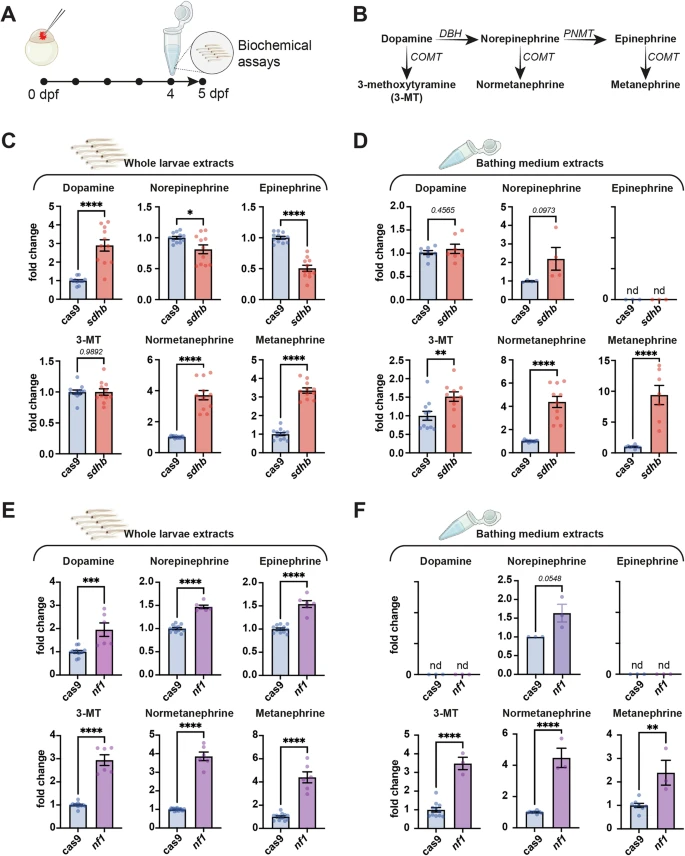
Fig. 2 Catecholamine and metanephrine levels are affected in PPGL CRISPant zebrafish models. A Individual embryos are microinjected at the one-cell stage and larvae are pooled at 4 dpf overnight. Catecholamines and metanephrines levels were assessed on day 5 from whole larvae lysates and bathing medium. B Metabolic path of catecholamines and metanephrine synthesis. Enzymes are italicized (DBH: Dopamine beta-hydroxylase, PNMT: Phenylethanolamine N-Methyltransferase, COMT: Catechol-O-methyltransferase). C,D Catecholamines and metanephrines levels in sdhb CRISPants (n ≥ 6 pools of 10 larvae) compared to Cas9-injected controls (n ≥ 6 pools of 10 larvae) (whole larvae, (C) and bathing medium (D)). E,F Catecholamines and metanephrines levels in nf1 CRISPants (whole larvae, (E) and bathing medium (F). Of note, the levels of NE were below the detection limit in Cas9-control samples, and a subjective basal value was used to calculate the NE fold-change increase in nf1-CRISPant larvae. Unpaired t-test with two-tailed p-value calculation: * p-value < 0.05; ** p-value < 0.01; *** p-value < 0.001; **** p-value < 0.0001. Icons are created in BioRender. Samarut, E. (2025) https://BioRender.com/xk8wiuf.