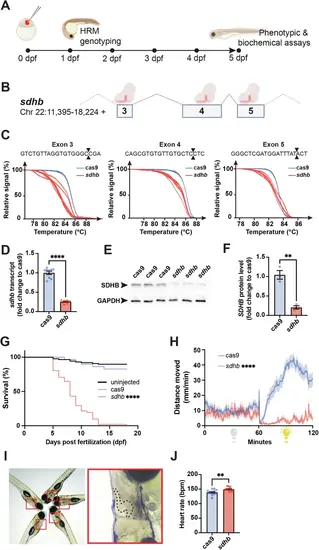
F0-injected sdhb-CRISPant zebrafish larvae display SDHB-associated phenotypes. A Timeline representation of our CRISPant approach starting with the microinjection of a gene-specific (i.e., sdhb) CRISPR/Cas9 mix in single-cell embryos, followed by High-Resolution Melting (HRM) genotyping from 1-day post-fertilization (dpf). Phenotypic and biochemical readouts can be acquired only few days following injection. B The genetic landscape of the zebrafish sdhb gene encompassing targeted exons 3, 4 and 5. C The mutagenic power of the injected CRISPR/Cas9 mix is validated by HRM comparing Cas9-injected embryos as controls in which only mRNA encoding CAS9 was microinjected (no gene-specific guide RNAs). D, E, F The level of sdhb expression is reduced in sdhb CRISPants both at the transcriptomic and protein levels as assessed by qRT-PCR (D) and western blot (E, F). (G) Survival of sdhb CRISPants (n = 51) is compared to Cas9-injected controls (n = 29) and uninjected larvae (n = 87) over 18 days. H The distance swam, binned per 30 s, is recorded for sdhb CRISPants (n = 32) and Cas9-injected controls (n = 32) during 60 min dark and 60 min light periods. I, J Representative setup and results of heart rate quantification in 5 dpf larvae (sdhb CRISPants, n = 13; Cas9-injected, n = 12). I Left: larvae mounted laterally in 3% methylcellulose for simultaneous video acquisition (~5 larvae per trial). Red boxes indicate individual larvae analyzed. Right: magnified view of one larva with the heart region outlined (dashed line), corresponding to the area used for automatic beat detection by DanioScope™ software. No anesthetic was used during acquisition. J Heart rate was quantified and compared using an unpaired t-test with two-tailed p-value calculation: ** p-value < 0.01; **** p-value < 0.0001. Icons in (A) and (B) are created in BioRender. Samarut, E. (2025)
|
