
|
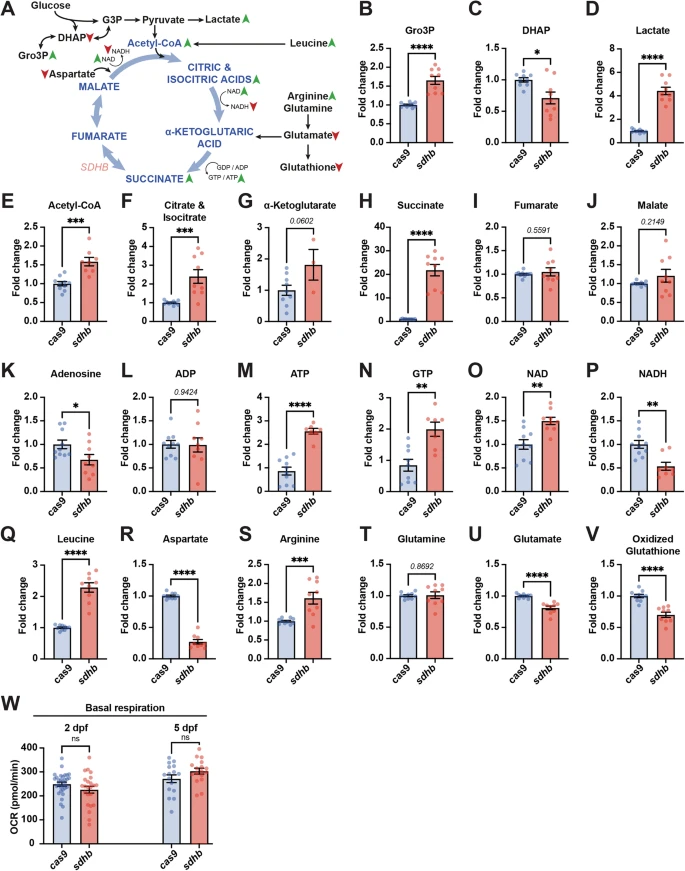
Fig. 3 sdhb CRISPants depict broad metabolic pertubations. A Schematic of Krebs cycle intermediates (in blue) and other metabolites from related pathways (in black) which have been assayed from whole 5 dpf larvae lysates. The changes observed in sdhb CRISPants are indicated with arrowheads (green: increase; red: reduction). B–V Individual metabolite quantified from whole sdhb-CRISPant larvae (pools of 10; n = 9 pools of 10) to Cas9-injected control larvae (n = 10 pools of 10). W Oxygen consumption rate (OCR) was measured in whole Cas9-injected control and sdhb-CRISPant larvae at 2 and 5 days post-fertilization (dpf) using a Seahorse XFe96 analyzer. Unpaired t-test with two-tailed p-value calculation: * p-value < 0.05; ** p-value < 0.01; *** p-value < 0.001; **** p-value < 0.0001.