
- Title
-
doc2a and doc2b contribute to locomotor and social behaviors by down-regulating npas4b in zebrafish
- Authors
- Chi, Y., Feng, T., Du, Z., Huang, P., Yu, W., Liu, H., Wang, W., Yang, X., Huang, L.
- Source
- Full text @ BMC Biol.
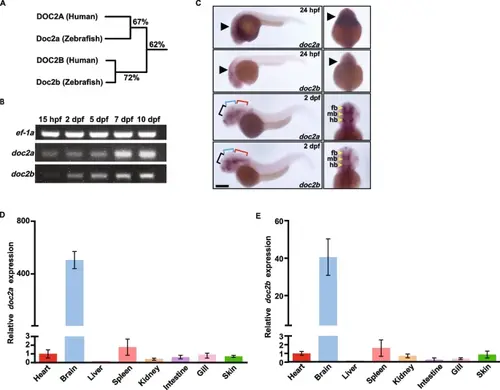
The spatiotemporal expression pattern of doc2a and doc2b in zebrafish. A: Homology tree based on alignment of amino acids of DOC2 homologs between human and zebrafish. Percentage values indicate the level of homology, which are quantified as the sequence identity. B: Agarose gel electrophoresis images for semi-qRT-PCR analysis of doc2a and doc2b mRNAs at 15 hpf, 2 dpf, 5 dpf, 7 dpf, and 10 dpf in WT zebrafish (n = 10). The protein ef-1a was used as an internal control. C: Representative pictures of WISH for doc2a and doc2b in WT at 24 hpf and 2 dpf (n = 15 for each stage). Black arrows: the mRNA locations of doc2a and doc2b. Black brackets: forebrain; Blue brackets: midbrain; Red brackets: hindbrain. fb: forebrain; mb: midbrain; hb: hindbrain. Scale bars: 100 µm. D and E: Specific expression of doc2a and doc2b in the brain of zebrafish. Relative mRNA expression levels of doc2a (D) and doc2b (E) were detected in tissues, including the heart, brain, liver, spleen, kidney, intestine, gill, and skin from adult WT zebrafish (n = 10) using qRT-PCR. The mRNA expression levels of doc2a and doc2b were normalized using ef-1a as an internal control. data were combined from three biological replicates EXPRESSION / LABELING:
|
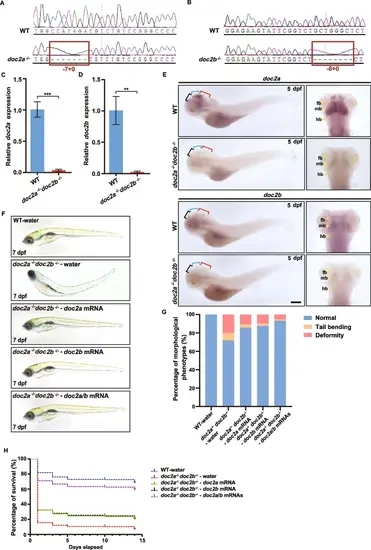
Abnormal development of doc2a−/−doc2b−/− mutants. A: The sequence chromatograms of the targeted regions from doc2a+/+ and doc2a−/−. Red boxes show the mutant genotype of doc2a with a 7 bp deletion. B: The sequence chromatogram of the targeted regions from the WT and the doc2b−/−. Red boxes show the mutant genotype of doc2b with an 8 bp deletion. C-D: Relative mRNA expression levels of doc2a (C) and doc2b (D) in the brain of the WT (n = 60) and the doc2a−/−doc2b−/− mutants (n = 60) were detected by qRT-PCR at 5 dpf. E: Representative pictures of WISH for doc2a and doc2b in the WT (n = 15) and the doc2a−/−doc2b−/− mutants (n = 15) at 5 dpf. Black brackets: forebrain; Blue brackets: midbrain; Red brackets: hindbrain. fb: forebrain; mb: midbrain; hb: hindbrain. Scale bars: 50 µm. F–H: Rescued morphological recovery and improvement in survival rate in the doc2a−/−doc2b−/− mutants with single or both doc2a or/and doc2b mRNAs. Representative morphological images of the WT injected with water and the doc2a−/−doc2b−/− mutants injected with mRNAs of doc2a or/and doc2b at 7 dpf (F). Proportion statistics of the developmental state among the WT injected with water (n = 140), the doc2a−/−doc2b−/− mutants injected with water (n = 49), the doc2a−/−doc2b−/− mutants injected with single mRNAs of doc2a (n = 104) or doc2b (n = 116) and co-injection of doc2a/b mRNAs (n = 301) (G). The survival rate in the WT injected with water (initial quantity of zebrafish: n = 240), the doc2a−/−doc2b−/− mutants injected with water (initial quantity of zebrafish: n = 450), the doc2a−/−doc2b−/− mutants injected with single mRNAs of doc2a (initial quantity of zebrafish: n = 450) or doc2b (initial quantity of zebrafish: n = 450) and co-injection of doc2a/b mRNAs (initial quantity of zebrafish: n = 450) (H). Scale bars: 200 µm. Statistical significance was determined using a two-tailed Student’s t-test; data were combined from three biological replicates |
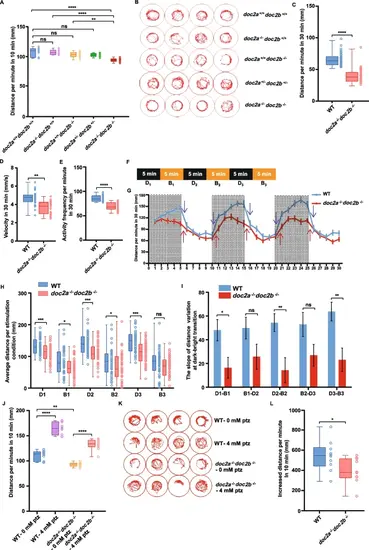
Decreased locomotion of the doc2a−/−doc2b−/− larvae. A-E: Decreased locomotion activity of the doc2a−/−doc2b−/− larvae in the locomotion activity test. Multiple comparison of distance traveled by the WT (n = 19), doc2a−/− (n = 21), the doc2b−/− (n = 25), doc2a+/-doc2b+/- (n = 90), and doc2a−/−doc2b−/− (n = 17) larvae per minute in the first 10 min at 5 dpf (A). Representative diagrams of motion trajectory from the WT, doc2a−/−, doc2b−/−, doc2a+/-doc2b+/-, and doc2a−/−doc2b−/− larvae in the first 10 min at 5 dpf. The res circle represented the edge of the well in the 96-well plate and the trace of zebrafish was located right in the center of the red circle (B). Comparison of distance traveled by the WT and the doc2a−/−doc2b−/− per minute in the total 30 min (C). Comparison of velocity between the WT and the doc2a−/−doc2b−/− at 5 dpf per second in the total 30 min (D). Comparison of activity frequency between the WT and the doc2a−/−doc2b−/− per minute in the total 30 min (E). F-I: Impaired locomotion activity of the doc2a−/−doc2b−/− larvae in the light/dark test. The time scale of Dark/Bright cycles: The activity was recorded under three 5-min dark/light transition stimulations (D1/B1, D2/B2, D3/B3) (F). The average distance traveled by the WT (n = 47) and doc2a−/−doc2b−/− (n = 47) larvae at 5 dpf per minute in 30 min. Purple arrows and red arrows indicate the slope variation at dark/light transitions in the WT and doc2a−/−doc2b−/− larvae at 5 dpf (G). Comparison of distance traveled by the WT and the doc2a−/−doc2b−/− in each dark condition or bright condition (H). Comparison of the slope variation in the WT and the doc2a−/−doc2b−/− at dark/bright transitions (I). J-L: Anti-seizure phenotype in the doc2a−/−doc2b−/− larvae at 5 dpf. Multiple comparisons of distance traveled by the WT (n = 17) and doc2a−/−doc2b−/− (n = 19) larvae at 5 dpf per minute in 10 min with or without 4 mM PTZ treatment (J). Representative diagrams of motion trajectory of the WT and doc2a−/−doc2b−/− larvae at 5 dpf with or without 4 mM PTZ treatment (K). Comparison of increased distance traveled by the WT and doc2a−/−doc2b−/− larvae at 5 dpf after 4 mM PTZ treatment (L). Statistical significance was determined by one-way ANOVA, Tukey’s test (A, J), or by two-tailed Student’s t-test (C, D, E, H, I, L); data were combined from three biological replicates; mean ± SE; *, P < 0.05; **, P < 0.01; ***, P < 0.001; ****, P < 0.0001; ns, no significance PHENOTYPE:
|
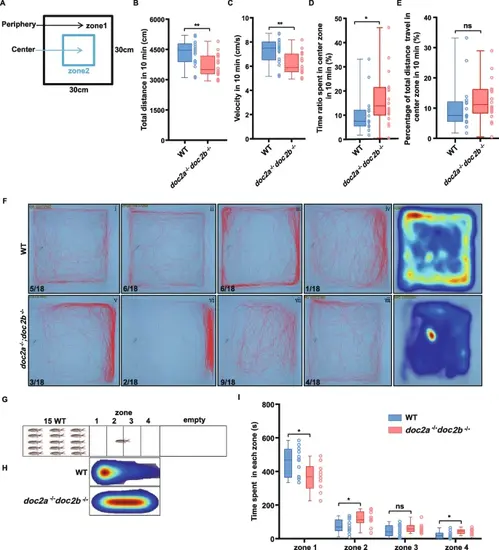
Reduced locomotion and impaired social interaction of the doc2a−/−doc2b−/− adults. A-F: Impaired locomotion activity in the doc2a−/−doc2b−/− adults. Schematic diagram of the open field test and thigmotaxis test in the WT (n = 18) and doc2a−/−doc2b−/− (n = 18) adults. Black arrow indicates the periphery zone and blue arrow indicates center zone in the blue square; the area of the peripheral zone is equal to the center zone (A). Total distance traveled by the WT and doc2a−/−doc2b−/− adults (B). Speed of movement in the WT and doc2a−/−doc2b−/− adults (C). Percentage of time spent in the center zone by the WT and doc2a−/−doc2b−/− adults (D). Percentage of total distance traveled by the WT and doc2a−/−doc2b−/− adults in the center zone (E). Representative diagrams and heat maps of motion tracks from the WT and doc2a−/−doc2b−/− adults in the open field test, with the indicated numbers of the movement patterns (F). G-I: Impaired social interaction in the doc2a−/−doc2b−/− adults. Schematic diagram of the social interaction test performed in the tank with 4 zones between a tank with 15 WT zebrafish and an empty tank (G). Representative heat maps of motion tracks from the WT (n = 12) and doc2a−/−doc2b−/− (n = 11) adults during the social interaction test (H). Comparison of time spent in each zone between the WT and doc2a−/−doc2b−/− adults (I). Statistical significance was determined using two-tailed Student’s t-test; data were combined from three biological replicates; mean ± SE; *, P < 0.05; **, P < 0.01; ****, P < 0.0001; ns, no significance PHENOTYPE:
|
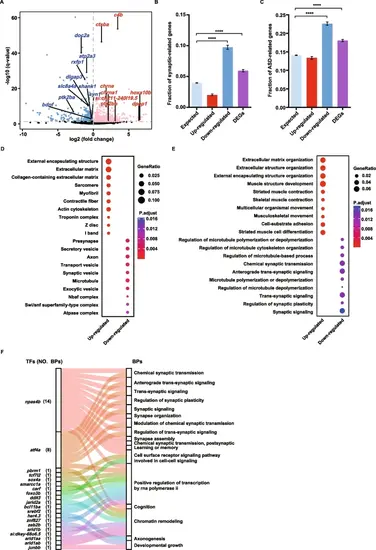
Brain transcriptome sequencing reveals synaptic dysregulation in the doc2a−/−doc2b−/− mutants. A: Volcano plot for differential expression genes (DEGs) based on mRNA expression levels in the doc2a−/−doc2b−/− mutants relative to the WT. FDR < 0.05. Red dots represent 746 up-regulated genes; blue dots represent 764 down-regulated genes and grey dots represent genes with no expression change. Highlighted genes are synaptic genes associated with autism. B and C: Enrichment of synaptic genes and ASD candidate genes in up-regulated genes, down-regulated genes and all DEGs. Statistical significance was determined by two-tailed Fisher’s exact test; ****, P < 0.0001; Error bars represent the standard error of the fraction, estimated using a bootstrapping method with 500 resamplings. D and E: Enriched Gene Ontology terms of the up-regulated genes, the down-regulated genes and all DEGs in the doc2a−/−doc2b−/− mutants. Top 10 enriched cellular components (D); Top 10 enriched biological processes (E). The enrichment analysis was performed using DAVID bioinformatics tool with FDR < 0.05. F: The Sankey diagram showing the relationship between TFs and the enriched BPs with DEGs. A total of 17 enriched BPs (the right column) contain 20 TFs (the left column); Each color links a TF to the BPs that contain it |
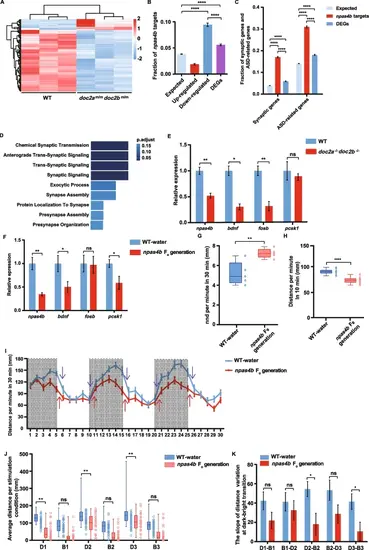
Downregulation of npas4b in the doc2a−/−doc2b−/− mutants leads to downregulation of genes involved in synaptic functions. A: Differential expression pattern of naps4b targets: Heatmap analysis based on mRNA expression levels of Npas4b targets in the doc2a−/−doc2b−/− compared to those in the WT; Each column represents a sample; each row represents a gene; Red color represents a relatively increased abundance, blue color represents a relatively decreased abundance, and white color represents no change. B: Enrichment of Npas4b targets in up-regulated genes, down-regulated genes and DEGs. C: Enrichment of synaptic genes and ASD candidate genes in the DEGs and the Npas4b targets. Statistical significance was determined by two-tailed Fisher’s exact test; ****, P < 0.0001; Error bars represent the standard error of the fraction, estimated using a bootstrapping method with 500 resamplings. D: Enriched BPs in Npas4b target DEGs. Fisher’s Exact Test was used for calculating p-values. E: The expression levels of npas4b and its target genes detected by qRT-PCR in the brain of the WT (n = 20) and the doc2a−/−doc2b−/− (n = 20) at 5 dpf. F: Relative mRNA expression levels of npas4b and its target genes in the brain of the WT-water group (n = 40) and the npas4b F0 generation (n = 40) were detected by qRT-PCR at 5 dpi. G: A decline in schooling behavior in the npas4b F0 generation (n = 100) comparing with the WT-water group (n = 100) and at 7 dpi, as assessed in the shoaling test. nnd, nearest neighbor distance. H: Reduced locomotion activity in the group of npas4b F0 generation (n = 45) comparing with the WT-water group (n = 45) at 5 dpi. I-K: Impaired locomotion activity of the npas4b F0 generation larvae in the light/dark test. The average distance traveled by the WT-water group (n = 45) and the npas4b F0 generation (n = 45) larvae at 5 dpf per minute in 30 min. Purple arrows and red arrows indicate the slope variation at light/dark transitions in the WT-water group and the npas4b F0 generation larvae at 5 dpf (I). Comparison of distance traveled by the WT-water group and the npas4b F0 generation larvae in each dark condition or bright condition (J). Comparison of the slope variation in the WT-water group and the npas4b F0 generation at dark/bright transitions (K). Statistical significance was determined using a two-tailed Student’s t-test; data were combined from three biological replicates; mean ± SE; *, P < 0.05; **, P < 0.01; ***, P < 0.001; ****, P < 0.0001; ns, no significance |