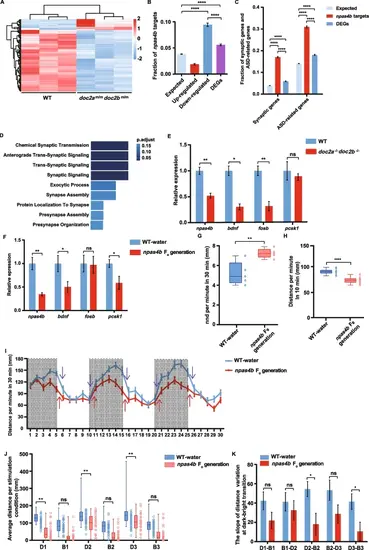
Downregulation of npas4b in the doc2a−/−doc2b−/− mutants leads to downregulation of genes involved in synaptic functions. A: Differential expression pattern of naps4b targets: Heatmap analysis based on mRNA expression levels of Npas4b targets in the doc2a−/−doc2b−/− compared to those in the WT; Each column represents a sample; each row represents a gene; Red color represents a relatively increased abundance, blue color represents a relatively decreased abundance, and white color represents no change. B: Enrichment of Npas4b targets in up-regulated genes, down-regulated genes and DEGs. C: Enrichment of synaptic genes and ASD candidate genes in the DEGs and the Npas4b targets. Statistical significance was determined by two-tailed Fisher’s exact test; ****, P < 0.0001; Error bars represent the standard error of the fraction, estimated using a bootstrapping method with 500 resamplings. D: Enriched BPs in Npas4b target DEGs. Fisher’s Exact Test was used for calculating p-values. E: The expression levels of npas4b and its target genes detected by qRT-PCR in the brain of the WT (n = 20) and the doc2a−/−doc2b−/− (n = 20) at 5 dpf. F: Relative mRNA expression levels of npas4b and its target genes in the brain of the WT-water group (n = 40) and the npas4b F0 generation (n = 40) were detected by qRT-PCR at 5 dpi. G: A decline in schooling behavior in the npas4b F0 generation (n = 100) comparing with the WT-water group (n = 100) and at 7 dpi, as assessed in the shoaling test. nnd, nearest neighbor distance. H: Reduced locomotion activity in the group of npas4b F0 generation (n = 45) comparing with the WT-water group (n = 45) at 5 dpi. I-K: Impaired locomotion activity of the npas4b F0 generation larvae in the light/dark test. The average distance traveled by the WT-water group (n = 45) and the npas4b F0 generation (n = 45) larvae at 5 dpf per minute in 30 min. Purple arrows and red arrows indicate the slope variation at light/dark transitions in the WT-water group and the npas4b F0 generation larvae at 5 dpf (I). Comparison of distance traveled by the WT-water group and the npas4b F0 generation larvae in each dark condition or bright condition (J). Comparison of the slope variation in the WT-water group and the npas4b F0 generation at dark/bright transitions (K). Statistical significance was determined using a two-tailed Student’s t-test; data were combined from three biological replicates; mean ± SE; *, P < 0.05; **, P < 0.01; ***, P < 0.001; ****, P < 0.0001; ns, no significance
|
