
|
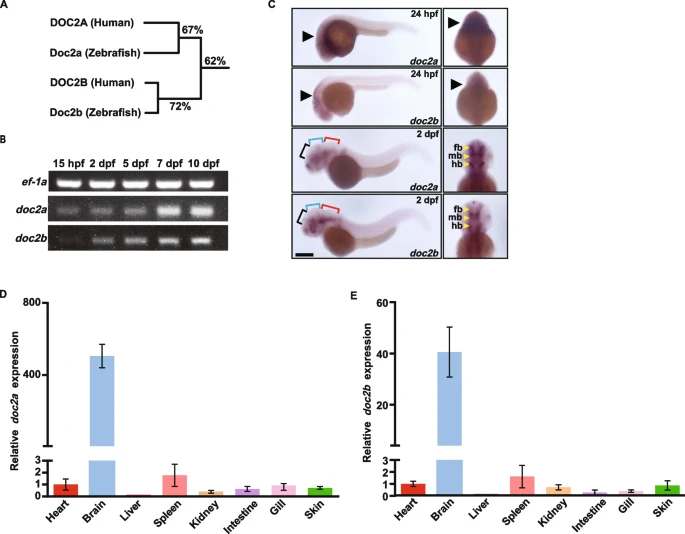
Fig. 1 The spatiotemporal expression pattern of doc2a and doc2b in zebrafish. A: Homology tree based on alignment of amino acids of DOC2 homologs between human and zebrafish. Percentage values indicate the level of homology, which are quantified as the sequence identity. B: Agarose gel electrophoresis images for semi-qRT-PCR analysis of doc2a and doc2b mRNAs at 15 hpf, 2 dpf, 5 dpf, 7 dpf, and 10 dpf in WT zebrafish (n = 10). The protein ef-1a was used as an internal control. C: Representative pictures of WISH for doc2a and doc2b in WT at 24 hpf and 2 dpf (n = 15 for each stage). Black arrows: the mRNA locations of doc2a and doc2b. Black brackets: forebrain; Blue brackets: midbrain; Red brackets: hindbrain. fb: forebrain; mb: midbrain; hb: hindbrain. Scale bars: 100 µm. D and E: Specific expression of doc2a and doc2b in the brain of zebrafish. Relative mRNA expression levels of doc2a (D) and doc2b (E) were detected in tissues, including the heart, brain, liver, spleen, kidney, intestine, gill, and skin from adult WT zebrafish (n = 10) using qRT-PCR. The mRNA expression levels of doc2a and doc2b were normalized using ef-1a as an internal control. data were combined from three biological replicates