FIGURE SUMMARY
Title

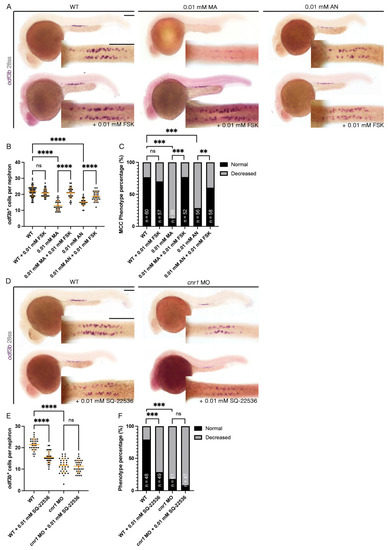
Cannabinoid Receptor 1 Regulates Zebrafish Renal Multiciliated Cell Development via cAMP Signaling

Authors
Nguyen, T.K., Baker, S., Angtuaco, J., Arceri, L., Kaczor, S., Fitzsimonds, B., Hawkins, M.R., Wingert, R.A.
Source
Full text @ J Dev Biol

Loss of cnr1 leads to reduction in both mature and progenitor MCC populations: (A) live imaging between different treatment groups between 24 and 72 hpf with the percentage of embryos with edema between 48–72 hpf (arrows indicate pericardial edema); scale bar = 200 μm; (B) 28 ss WT, cnr1 MO stained via WISH using the mature MCC marker odf3b and cetn4; scale bar = 50 μm; (C,D) number of odf3b+ and cetn4+ cells per nephron at 28 ss; (E) 24 ss WT, cnr1 MO stained via WISH using the progenitor MCC marker pax2a and jag2b; scale bar = 50 μm; (F,G) number of pax2a+ and jag2b+ cells per nephron at 24 ss. Data presented on graphs are represented as mean ± SD; **** p < 0.0001 (t-test).

cnr1 agonism leads to reduction in mature MCC population: (A) 28 ss WT, 0.01 mM MA and 0.01 mM AN-treated embryos stained via WISH using the mature MCC marker odf3b and cetn4; scale bar = 50 μm; (B,C) number of odf3b+ and cetn4+ cells per nephron at 28 ss; (D) 24 ss WT, 0.01 mM MA and 0.01 mM AN-treated embryos stained via WISH using the progenitor MCC marker pax2a and jag2b; scale bar = 50 μm; (E,F) number of pax2a+ and jag2b+ cells per nephron at 24 ss. Data presented on graphs are represented as mean ± SD; * p < 0.05 and **** p < 0.0001 (ANOVA).

cnr1 antagonism leads to reduction in mature MCC population: (A) 28 ss WT, 0.02 mM AM-251 and 0.02 mM AM-281-treated embryos stained via WISH using the mature MCC marker odf3b and cetn4; scale bar = 50 μm; (B,C) number of odf3b+ and cetn4+ cells per nephron at 28 ss; (D) 24 ss WT, 0.02 mM AM-251 and 0.02 mM AM-281-treated embryos stained via WISH using the progenitor MCC marker pax2a and jag2b; scale bar = 50 μm; (E,F) number of pax2a+ and jag2b+ cells per nephron at 24 ss. Data presented on graphs are represented as mean ± SD;** p < 0.01 (ANOVA).

Loss of cnr1 leads to cilia defects across embryonic tissues: (A) 28 hpf whole-mount IF for acetylated α-tubulin (cilia, green), γ-tubulin (basal bodies, red) and DAPI (nucleus, blue) in the proximal segment of WT, cnr1 MO and embryos treated with 0.02 mM AM-251; scale bar = 50 μm; (B) proximal cilia length at 28 hpf; (C) fluorescence intensity plot of α-tubulin intensity within the proximal segment at 28 hpf; (D) number of basal bodies in the proximal segment at 28 hpf; (E) percentage of ciliated basal bodies/total basal bodies in the proximal segment at 28 hpf; (F) 10 ss whole-mount IF for acetylated α-tubulin (cilia, green), anti-PKC (membrane boundary, red) and DAPI (nucleus, blue) in the KV of WT and cnr1 MO embryos; scale bar = 50 μm; (G) 4 dpf whole-mount IF for acetylated α-tubulin (cilia, green) and DAPI (nucleus, blue) in the neuromast of WT and cnr1 MO embryos; scale bar = 25 μm; (H) KV cilia length at 10 ss; (I) neuromast cilia length at 4 dpf; (J) 4 dpf whole-mount IF for acetylated α-tubulin (cilia, green) and DAPI (nucleus, blue) in the anterior macula and crista of WT and cnr1 MO embryos; scale bar = 25 μm; (K) 4 dpf whole-mount IF for acetylated α-tubulin (cilia, green), γ-tubulin (basal bodies, red) and DAPI (nucleus, blue) in the nasal placode of WT and cnr1 MO embryos; scale bar = 25 μm; (L,M) nasal MCC area and nasal placode area at 4 dpf; (N) number of nasal MCCs at 4 dpf; (O) 55 hpf WT and cnr1 MO embryos stained via WISH using heart marker myl7; scale bar = 50 μm; (P) phenotype percentage of heart looping phenotypes at 55 hpf. Data presented on graphs are represented as mean ± SD; ** p < 0.01 *** p < 0.001 and **** p < 0.0001 (t-test (H,I,LN), ANOVA (BE) and Fisher’s exact test (P)).

cnr1 regulates renal MCC development via cAMP signaling and independently: (A,D) 28 ss embryos between experimental groups stained via WISH using the mature MCC marker odf3b; scale bar = 50 μm; (B,E) number of odf3b+ cells per nephron at 28 ss; (C,F) phenotype percentage of MCC phenotypes at 28 ss. Data presented on graphs are represented as mean ± SD; ** p < 0.01 *** p < 0.001 and **** p < 0.0001 (ANOVA (Figure 4B,E) and Fisher’s exact test with Holm’s correction (Figure 4C,F)).

Roadmap delineating the relationship between Cnr1 and players in renal MCC development.

Acknowledgments
This image is the copyrighted work of the attributed author or publisher, and ZFIN has permission only to display this image to its users. Additional permissions should be obtained from the applicable author or publisher of the image. Full text @ J Dev Biol