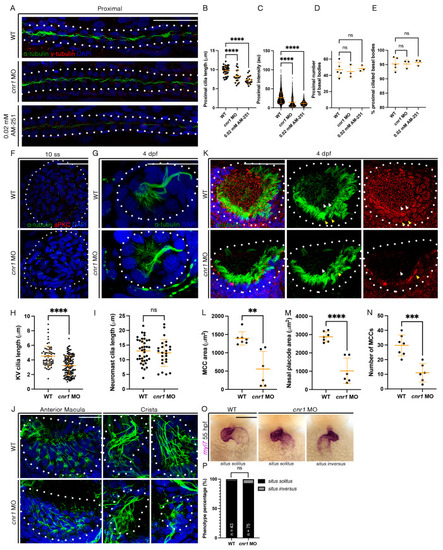
Loss of cnr1 leads to cilia defects across embryonic tissues: (A) 28 hpf whole-mount IF for acetylated α-tubulin (cilia, green), γ-tubulin (basal bodies, red) and DAPI (nucleus, blue) in the proximal segment of WT, cnr1 MO and embryos treated with 0.02 mM AM-251; scale bar = 50 μm; (B) proximal cilia length at 28 hpf; (C) fluorescence intensity plot of α-tubulin intensity within the proximal segment at 28 hpf; (D) number of basal bodies in the proximal segment at 28 hpf; (E) percentage of ciliated basal bodies/total basal bodies in the proximal segment at 28 hpf; (F) 10 ss whole-mount IF for acetylated α-tubulin (cilia, green), anti-PKC (membrane boundary, red) and DAPI (nucleus, blue) in the KV of WT and cnr1 MO embryos; scale bar = 50 μm; (G) 4 dpf whole-mount IF for acetylated α-tubulin (cilia, green) and DAPI (nucleus, blue) in the neuromast of WT and cnr1 MO embryos; scale bar = 25 μm; (H) KV cilia length at 10 ss; (I) neuromast cilia length at 4 dpf; (J) 4 dpf whole-mount IF for acetylated α-tubulin (cilia, green) and DAPI (nucleus, blue) in the anterior macula and crista of WT and cnr1 MO embryos; scale bar = 25 μm; (K) 4 dpf whole-mount IF for acetylated α-tubulin (cilia, green), γ-tubulin (basal bodies, red) and DAPI (nucleus, blue) in the nasal placode of WT and cnr1 MO embryos; scale bar = 25 μm; (L,M) nasal MCC area and nasal placode area at 4 dpf; (N) number of nasal MCCs at 4 dpf; (O) 55 hpf WT and cnr1 MO embryos stained via WISH using heart marker myl7; scale bar = 50 μm; (P) phenotype percentage of heart looping phenotypes at 55 hpf. Data presented on graphs are represented as mean ± SD; ** p < 0.01 *** p < 0.001 and **** p < 0.0001 (t-test (H,I,L–N), ANOVA (B–E) and Fisher’s exact test (P)).
|
