IMAGE

Figure 3

ID
ZDB-IMAGE-250627-48
Source
Figures for Nguyen et al., 2025
Image
Figure Caption

Figure 3

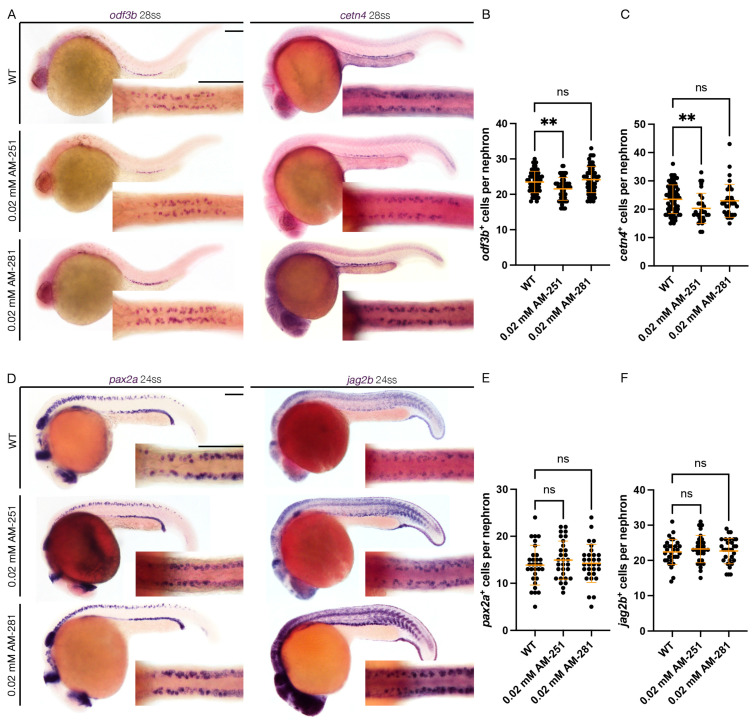
cnr1 antagonism leads to reduction in mature MCC population: (A) 28 ss WT, 0.02 mM AM-251 and 0.02 mM AM-281-treated embryos stained via WISH using the mature MCC marker odf3b and cetn4; scale bar = 50 μm; (B,C) number of odf3b+ and cetn4+ cells per nephron at 28 ss; (D) 24 ss WT, 0.02 mM AM-251 and 0.02 mM AM-281-treated embryos stained via WISH using the progenitor MCC marker pax2a and jag2b; scale bar = 50 μm; (E,F) number of pax2a+ and jag2b+ cells per nephron at 24 ss. Data presented on graphs are represented as mean ± SD;** p < 0.01 (ANOVA).

Acknowledgments
This image is the copyrighted work of the attributed author or publisher, and ZFIN has permission only to display this image to its users. Additional permissions should be obtained from the applicable author or publisher of the image. Full text @ J Dev Biol