FIGURE SUMMARY
Title

Epicoccin A Ameliorates PD-like Symptoms in Zebrafish: Enhancement of PINK1/Parkin-Dependent Mitophagy and Inhibition of Excessive Oxidative Stress

Authors
Ye, H., Li, D., Zhang, L., Wang, Y., Wang, C., Jin, M., Lin, H., Li, P., Sun, C., Li, N.
Source
Full text @ Mar. Drugs

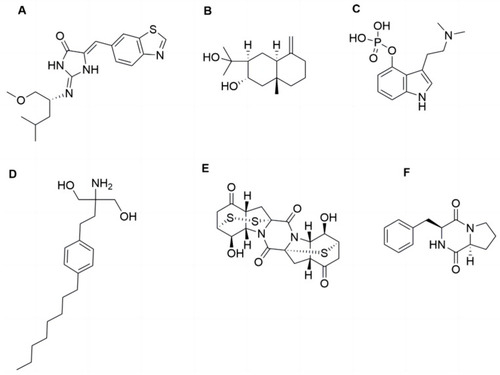
The structures of epicoccin A and the compounds mentioned. (A) Leucettinib-21. (B) Arctiol. (C) Psilocybin. (D) Fingolimod. (E) Epicoccin A. (F) Cyclo-(L-Pro-L-Phe).

Remissive effect of epicoccin A on the loss of DA neurons in PD. (A) Representative fluorescent images of slc18a2:GFP zebrafish, where the length of the subset of DA neurons analyzed were denoted by the red brackets. Scale bar, 200 μm. (B) Statistical analysis of the length of the subset of DA neurons in each group, n = 8. The data are presented as mean ± SEM; ####p < 0.0001 compared to the control group; ** p < 0. 01 and **** p < 0.0001 compared to the MPTP group.

The inhibitory effect of epicoccin A on MPTP-induced nervous system injury in zebrafish brains. (A) Representative fluorescent microscopy images of elavl3:EGFP zebrafish from the control, MPTP, rasagiline, and epicoccin A plus MPTP co-treatment groups. Scale bar, 500 μm. (B) Statistical analysis of the average fluorescent intensity in the midbrain regions (as indicated by red dotted lines) of zebrafish in each group, n = 8. (C) Statistical analysis of the average fluorescent intensity in the partial hindbrain regions (as indicated by yellow dotted lines) of zebrafish in each group, n = 8. The data are presented as mean ± SEM; ####p < 0.0001 compared to the control group; **** p < 0.0001 compared to the MPTP group.

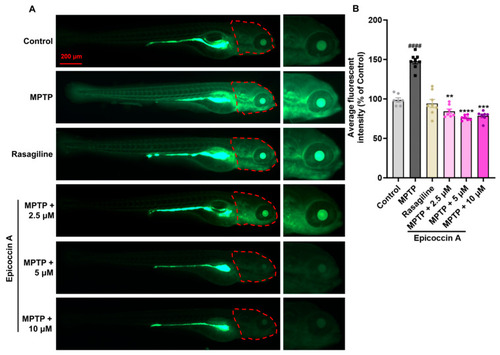
Ameliorative effect of epicoccin A on MPTP-induced loss and disorganization of neural vasculature. Representative fluorescent microscopy images of flk1:GFP zebrafish from the control, MPTP, rasagiline, and epicoccin A plus MPTP co-treatments. Red arrows indicated the loss of neural vasculature induced by MPTP. Yellow arrows indicated the unmarred or incompletely injured neural vasculature as compared with the MPTP treatment. Scale bar, 500 μm.

The inhibitory effect of epicoccin A on ROS overproduction in the brains of zebrafish with PD. (A) Fluorescent images depicting ROS levels in zebrafish larvae from control, MPTP, rasagiline, and epicoccin A plus MPTP co-treatments. Enlarged images are provided for clear visualization. Scale bar, 200 µm. (B) Quantification of fluorescent intensity representing ROS levels in the brains (as indicated by red dotted lines) of zebrafish larvae in each group, n = 8. The data are presented as mean ± SEM; ####p < 0.0001 compared to the control group; ** p < 0.01, *** p < 0.001, and **** p < 0.0001 compared to the MPTP group.

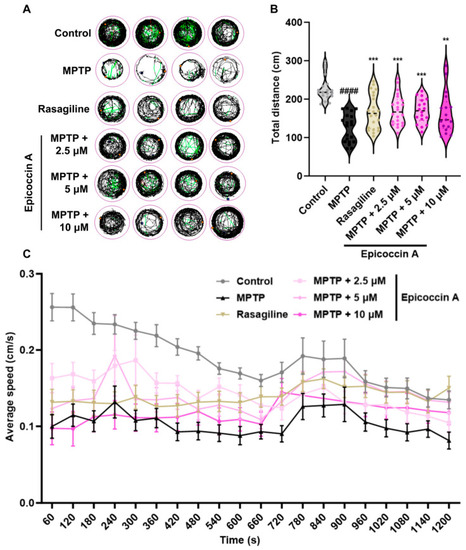
Improved effect of epicoccin A on MPTP-induced locomotor impairment in zebrafish. (A) Four representative movement trajectories of zebrafish from control, MPTP, rasagiline, and epicoccin A plus MPTP co-treatments, n = 22. Red, green, and black lines represent fast (>0.5 cm/s), medium (0.2–0.5 cm/s), and slow (<0.2 cm/s) movement trajectories, respectively. (B) The total distance moved by zebrafish, n = 22. (C) Average speed was calculated at every 60 s interval within the 20 min recording period for all individuals from each group, n = 22. The data are presented as the mean ± SEM; ####p < 0.0001 compared to the control group; ** p < 0.01 and *** p < 0.001 compared to the MPTP group.

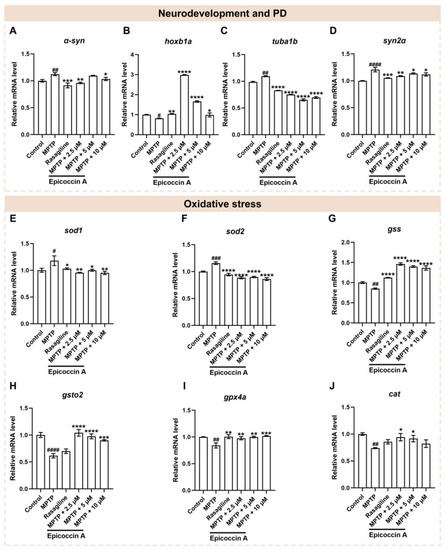
The mRNA expression levels of genes associated with PD, neurodevelopment, and oxidative stress. The expressions of α-syn (A), hoxb1a (B), tuba1b (C), syn2α (D), sod1 (E), sod2 (F), gss (G), gsto2 (H), gpx4a (I), and cat (J) after epicoccin A co-treatments. The data are presented as mean ± SEM; #p < 0.05, ##p < 0.01, ###p < 0.001, and ####p < 0.0001 compared to the control group; * p < 0.05, ** p < 0.01, *** p < 0.001, and **** p < 0.0001 compared to the MPTP group.

The mRNA expression levels of genes associated with mitophagy. The expressions of pink1 (A), parkin (B), atg7 (C), atg12 (D), ulk1b (E), beclin1 (F), ambra1a (G), and lc3b (H) after epicoccin A co-treatment. The data are presented as mean ± SEM; ##p < 0.01, ###p < 0.001, and ####p < 0.0001 compared to the control group; * p < 0.05, ** p < 0.01, *** p < 0.001, and **** p < 0.0001 compared to the MPTP group.

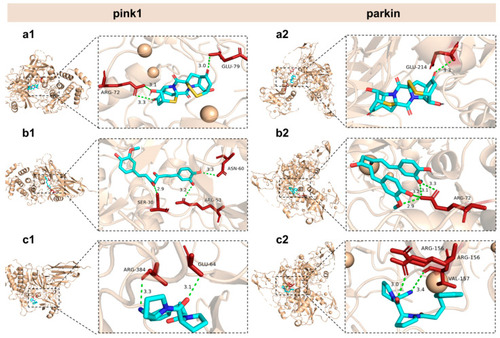
General and local perspectives of docking simulation of interactions between ligands and receptors, with pink1 and parkin being the receptors considered. Epicoccin A (a1,a2), curcumin (b1,b2), and KYP-2047 (c1,c2) were used as molecularly docked ligands. Among them, curcumin and KYP-2047, two well-established potential anti-PD compounds, served as positive controls.

Transcriptome analysis. KEGG enrichment analysis of DEGs in MPTP vs. control (A) and epicoccin A vs. MPTP (B).

mRNA expression levels of genes related to the mTOR/FoxO signaling pathway. The expressions of foxO3a (A), mtor (B), ppargc1α (C), tsc1 (D), prkaα1 (homologous gene of ampk in zebrafish, (E), and sesn2 (F) after epicoccin A co-treatment. The data are presented as mean ± SEM; ##p < 0.01 and ####p < 0.0001 compared to the control group; *** p < 0.001 and **** p < 0.0001 compared to the MPTP group.

The proposed mechanism underlying the anti-PD effect of epicoccin A. Epicoccin A co-treatments can reverse the abnormal expressions of genes related to neuronal development, contributing to the improvement of neuronal damage in PD. Co-treatments with epicoccin A improved the aberrant gene expressions in the mTOR/FoxO signaling pathway, which might activate pink1/parkin-dependent mitophagy. This process facilitated the degradation of damaged mitochondria and α-synuclein fibrils, thereby inhibiting the formation of LBs. Moreover, epicoccin A co-treatments can inhibit oxidative stress by reducing ROS accumulation, further enhancing mitophagy and consequently alleviating the onset and development of PD.

The experimental workflow chart. Larvae at 24 hpf were co-treated with MPTP and each of three different concentrations of epicoccin A from 24 hpf to either 96 hpf or 120 hpf. The developmental assessments of DA neurons, the nervous system, and the neural vasculature were conducted at 96 hpf. At 120 hpf, treated zebrafish were subjected to evaluations of locomotor behavior, ROS generation, expressions of genes related to PD, neurodevelopment, mitophagy, and oxidative stress, as well as transcriptome analysis.

Acknowledgments
This image is the copyrighted work of the attributed author or publisher, and ZFIN has permission only to display this image to its users. Additional permissions should be obtained from the applicable author or publisher of the image. Full text @ Mar. Drugs