IMAGE

Figure 6

ID
ZDB-IMAGE-250428-108
Source
Figures for Ye et al., 2025
Image
Figure Caption

Figure 6

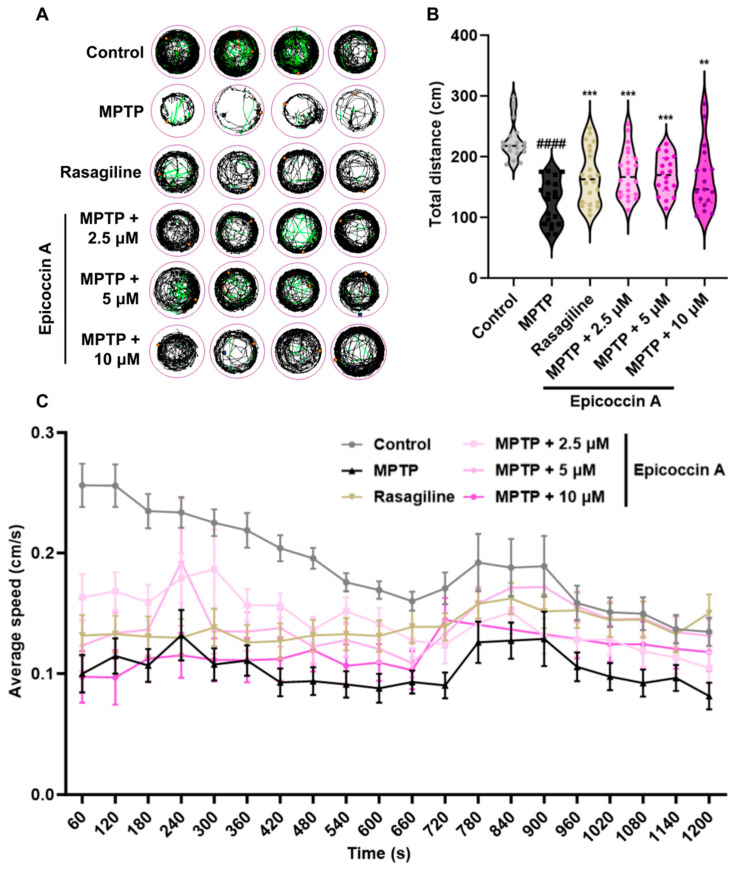
Improved effect of epicoccin A on MPTP-induced locomotor impairment in zebrafish. (A) Four representative movement trajectories of zebrafish from control, MPTP, rasagiline, and epicoccin A plus MPTP co-treatments, n = 22. Red, green, and black lines represent fast (>0.5 cm/s), medium (0.2–0.5 cm/s), and slow (<0.2 cm/s) movement trajectories, respectively. (B) The total distance moved by zebrafish, n = 22. (C) Average speed was calculated at every 60 s interval within the 20 min recording period for all individuals from each group, n = 22. The data are presented as the mean ± SEM; ####p < 0.0001 compared to the control group; ** p < 0.01 and *** p < 0.001 compared to the MPTP group.

Acknowledgments
This image is the copyrighted work of the attributed author or publisher, and ZFIN has permission only to display this image to its users. Additional permissions should be obtained from the applicable author or publisher of the image. Full text @ Mar. Drugs