FIGURE SUMMARY
Title

Restoration of retinal regenerative potential of Müller glia by disrupting intercellular Prox1 transfer

Authors
Lee, E.J., Kim, M., Park, S., Shim, J.H., Cho, H.J., Park, J.A., Park, K., Lee, D., Kim, J.H., Jeong, H., Matsuzaki, F., Kim, S.Y., Kim, J., Yang, H., Lee, J.S., Kim, J.W.
Source
Full text @ Nat. Commun.

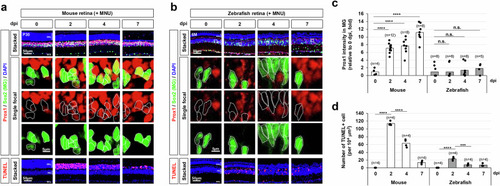
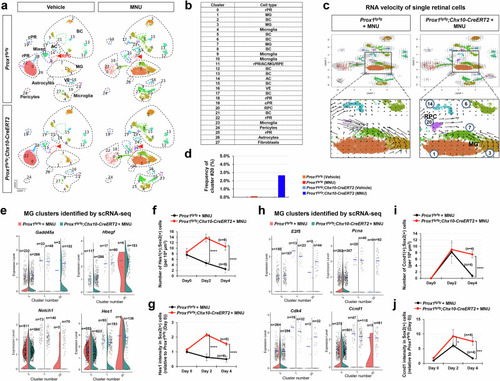
Injury-induced accumulation of Prox1 in mouse MG.

a, b Retinal injury was induced in P30 mice (a) and 6-month-old zebrafish (b) through intraperitoneal injection of MNU, followed by immunostaining to assess Prox1 distribution in the retinas of both species. The bottom row displays single focal images, magnified from the boxed areas in the stacked images shown in the top row. Sox2-positive MG nuclei are outlined by dotted lines. Nuclei of the retinal cells are visualized by DAPI staining. c Relative Prox1 immunofluorescent intensity in MG at the indicated days post-injury (dpi), normalized to Prox1 intensity in BCs within the same image, is shown in the graph. Each dot represents the median intensity collected from one retina. Numbers of samples analyzed are shown in the graph (data from 4–6 independent litters). d Quantification of TUNEL-positive apoptotic cells in the specified retinal area. Columns represent mean values. Number of samples analyzed is 4. Statistical significance (p-values) of the data in (c) and (d) was calculated using one-sided Student’s t-test (*, p < 0.05; **, p < 0.01; ***, p < 0.005; ****, p < 0.001; not significant (n.s.), p > 0.05).

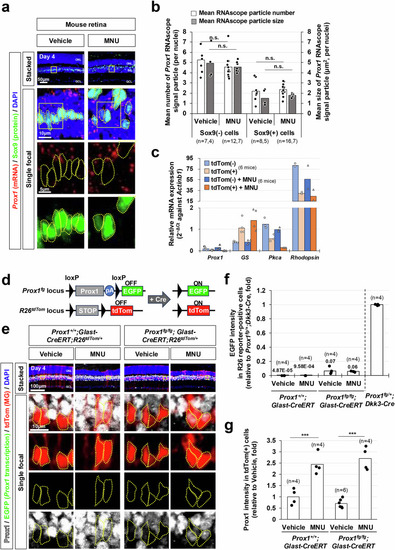
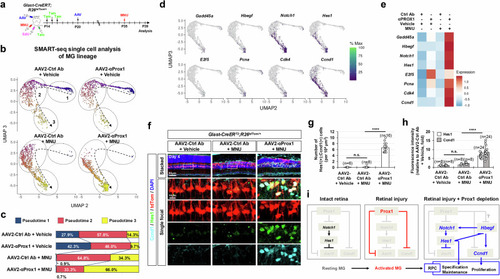
Exogenous origin of Prox1 in mouse MG.

aProx1 mRNA in mouse retinal sections was visualized using RNAscope, combined with immunostaining for the MG marker Sox9. b Mean number and size of Prox1 RNAscope signals in MG nuclei and the rest INL cell nuclei are presented in the graph. Numbers of samples analyzed are shown in the graph (data from 3 independent litters). c tdTom-positive and tdTom-negative retinal cells were isolated from Glast-CreERT;R26+/tdTom mouse retinas by FACS. Relative mRNA expression of indicated genes to Actinb1 was determined by their cycle threshold (Ct) scores obtained using RT-qPCR (data from 4 independent batches). d, e Complementary EGFP expression from the mouse Prox1 gene locus, following Cre-dependent excision of Prox1 cDNA, was assessed by co-immunostaining mouse retinal sections with chicken anti-GFP and rabbit anti-Prox1 antibodies. Cre activity in the same retinal areas was verified by expression of R26tdTom reporter. tdTom-positive cell bodies are outlined by dotted-lines. pA, polyA transcription terminator. f EGFP intensity in tdTom-positive cells was measured by confocal microscopy. The relative intensity, normalized to the EGFP intensity of cells in Prox1fg/+;Dkk3-Cre mouse retinas (data shown in Supplementary Fig. 3a), is plotted. Numbers of samples analyzed are shown in the graph (data collected from 3 independent litters). The mean values are indicated in the graph. g Relative Prox1 immunofluorescent intensity in MG in the corresponding retina, normalized to Prox1 intensity in BCs within the same image, is plotted. Each dot represents the median intensity collected from one retina. Numbers of samples analyzed are shown in the graph (data from 3 independent litters). P-values in the graphs were calculated using one-sided Student’s t-test (n.s., p > 0.05; ***, p < 0.005).

Prox1 gene deletion in donor retinal neurons restores MG proliferative potential.

a Schematic representation of Prox1 depletion in MG achieved through Prox1 gene deletion in BC. (b) Prox1 was selectively deleted and EGFP was complementarily expressed in BCs of Prox1fg/fg;Chx10-CreERT2 mouse retinas by repeated Tamoxifen (Tam) injections. Following this, mice were injected with MNU to induce PR degeneration and EdU to label proliferating cells. As indicated, FLAG-Prox1 recombinant protein (250 fmol) or FLAG peptides were injected intravitreally. c Distribution of Prox1, Sox2, and EGFP in the retinas of Prox1fg/fg and Prox1fg/fg;Chx10-CreERT2 littermates was assessed by immunostaining. Sox2-positive MG nuclei are outlined by dotted-lines. d Relative Prox1 immunofluorescent intensity in MG in the corresponding retina, normalized to Prox1 intensity in BCs within the same image, is shown. Each dot represents the median intensity collected from one retina. Number of samples analyzed is 4. e MG and microglial identities of EdU-labeled newborn cells in mouse retinas were determined by co-staining Sox2 and Iba1. The boxed areas in the top row are enlarged in the following two rows. Arrowheads point to EdU-labeled cell nuclei. f Quantification of EdU-labeled MG and microglia in the retinas is shown in the graph. g Composition of EdU-labeled cells in the mouse retinas is displayed in the graph. Numbers of samples analyzed are shown in the graph (data from 4 independent litters). Error bars denote SEM. P-values were calculated using one-sided Student’s t-test (***, p < 0.005; ****, p < 0.001; n.s., > 0.05).

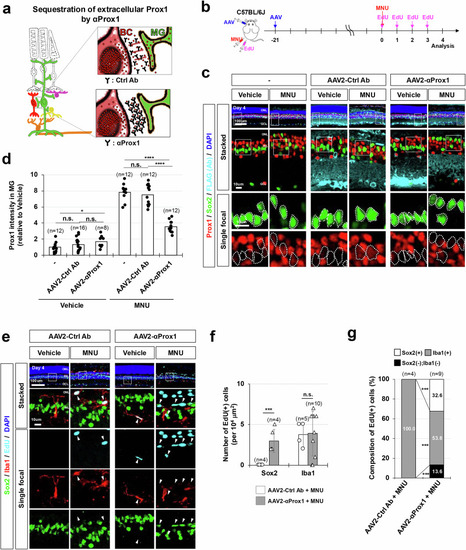
Sequestration of extracellular Prox1 by anti-Prox1 antibody restores MG proliferative potential.

a Schematic representation of Prox1 depletion in MG through sequestration of extracellular Prox1 protein by αProx1. b C57BL/6 J mice received intravitreal injections of AAV2-Ctrl Ab or AAV2-αProx1 at a concentration of 5 × 109 genome copies/eye. Mice were subsequently injected with MNU to induce retinal injury and EdU to label newly generated cells following MNU injury. c Retinas of the infected mice were subjected to immunostaining using mouse anti-FLAG antibody to detect FLAG-tagged proteins. Additionally, the distribution of Prox1 in the retinas was assessed by co-immunostaining with rabbit anti-Prox1 antibody. The MG identity of Prox1-positive cells was also determined through co-immunostaining with goat anti-Sox2 antibody. Enlarged views of boxed areas from the top row are presented in the second row and further magnified in the bottom rows, with Sox2-positive MG nuclei outlined by dotted lines. d Relative Prox1 immunofluorescent intensity in MG in the corresponding retina, normalized to Prox1 intensity in BCs within the same image, is shown. Each dot represents the median intensity collected from one retina. Numbers of samples analyzed are shown in the graph (data from 4 independent litters). e The identities of EdU-labeled cells in the retinas were determined by co-staining of Sox2 and Iba1. The boxed areas in the top row are magnified in subsequent rows. Arrowheads indicate EdU-labeled cell nuclei. (f) Quantification of EdU-labeled MG and microglia in the retinas is shown in the graph. Numbers of samples analyzed are shown in the graph (data from 4 independent litters). g Composition of EdU-labeled cells in the mouse retinas is displayed in the graph. Error bars denote SEM. P-values were calculated using one-sided Student’s t-test (*, p < 0.05; ***, p < 0.005; ****, p < 0.001; n.s., >0.05).

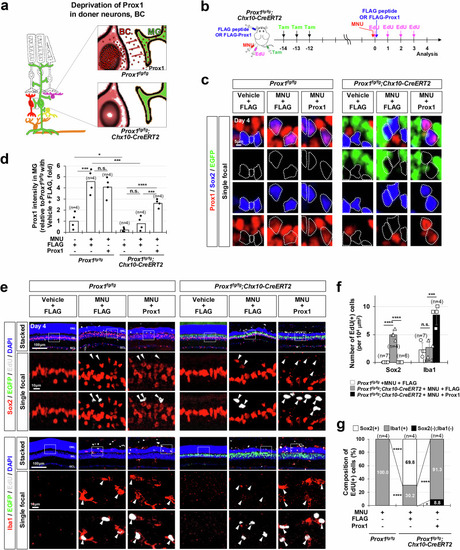
Injury-induced emergence of RPCs in the mouse retina following Prox1 deletion in BCs.

a Single-cell RNA sequencing (scRNA-seq) analysis was performed to examine mRNA expression in cells from Prox1fg/fg and Prox1fg/fg;Chx10-CreERT2 mouse retinas before and after MNU injury (see “Methods” for details). Uniform Manifold Approximation and Projection (UMAP) plots show retinal cells clustered by cell type. Red arrowheads indicate cluster #20. b The identity of each cell cluster is summarized in the accompanying table. c RNA velocity profiles derived from scRNA-seq data for MNU-injured Prox1fg/fg and Prox1fg/fg;Chx10-CreERT2 mouse retinas. Magnified views of boxed areas in the top panels are displayed in the bottom. d The frequency of cluster #20 in the retinas of the indicated mouse genotypes is shown in the graph. e Violin plots depicting the expression levels of Gadd45a, Hbegf, Notch1, and Hes1 mRNA in the indicated cell clusters identified through scRNA-seq analyses of MNU-injured Prox1fg/fg and Prox1fg/fg;Chx10-CreERT2 mice. Each dot represents gene expression level in individual cells, with the number of dots (n) indicated for each group. Blue horizontal bars indicate mean expression values. f, g The distribution of Hes1 in MNU-injured Prox1fg/fg and Prox1fg/fg;Chx10-CreERT2 mice mouse retinas was analyzed by immunostaining (images provided in Supplementary Fig. 14a). Graphs show the number of Hes1-expressing MG (f) and the intensity of Hes1 in MG (g). The number of retinas analyzed is indicated in the graphs. h Violin plots illustrate the expression levels of E2f5, Pcna, Cdk4, and Ccnd1 mRNA in specific cell clusters. i, j The distribution of Ccnd1 in retinas was analyzed by immunostaining (images shown in Supplementary Fig. 14b). Graphs display the number of Ccnd1-expressing MG (i) and the intensity of Ccnd1 in MG (j). Error bars denote SEM. P-values were calculated using one-sided Student’s t-test (*, p < 0.05; ****, p < 0.001).

Injury-induced reprogramming of MG into RPCs upon reduced Prox1 transfer.

a Retinas from Glast-CreERT;R26tdTom/+ mice infected with AAV2-Ctrl Ab or AAV2-αProx1 were injured using MNU. MG lineage cells were then purified by FACS at the indicated time points for SMART-seq analysis (ae) or analyzed by immunostaining for RPC markers (fh). b UMAP plots from Monocle 3 analysis of SMART-seq data for FACS-purified tdTom-positive cells in vehicle- or MNU-treated Glast-CreERT;R26tdTom/+ mouse retinas (details in Methods). Dotted arrows indicate pseudotime progression, with circled areas marking distinct populations by pseudotime intervals. c Pseudotime distributions of cell populations for each sample are shown. d Pseudotime distributions of cells expressing RPC and proliferative cell marker mRNAs are plotted. e Heatmap displaying the mean expression levels of the indicated mRNAs in each sample. f Distribution of Ccnd1 and Hes1 in AAV2-infected Glast-CreERT;R26tdTom/+ mouse retinas was assessed by immunostaining. Magnified views of boxed areas in the top row are shown in the subsequent rows. g, h Graphs show the number of Ccnd1 and Hes1 double-positive cells (g) and the relative intensity of Ccnd1 and Hes1 in these cells (h). Error bars denote SEM. ****, p < 0.001; n.s., > 0.05 (one-sided Student’s t-test). i A hypothetical model illustrating the negative regulation of injury-induced MG reprogramming into RPCs by Prox1.

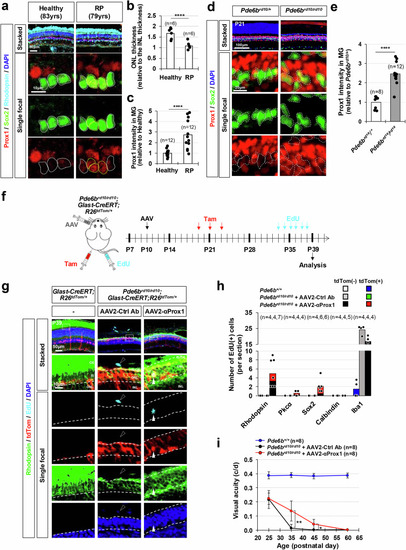
Delaying vision loss in early-onset RP model mice via viral gene delivery of anti-Prox1 antibody.

a Retinal sections from a healthy 83-year-old donor eye and a 79-year-old RP patient eye were stained with rabbit anti-Prox1, goat anti-Sox2, and mouse anti-Rhodopsin antibodies. Nuclei of the cells in the retinal sections were visualized by DAPI staining. Sox2-positive MG nuclei are outlined by dotted-lines. b The thickness of the ONL in the healthy and RP patient retina was compared to the thickness of the INL in the same section, and the relative values are presented in the graph. Numbers of samples analyzed are shown in the graph (data from 6 independent retinal sections from 2 eyes). ****, p < 0.001 (one-sided Student’s t-test) (c) Relative Prox1 immunofluorescent intensity in MG in the corresponding retina, normalized to Prox1 intensity in BCs within the same image, is shown. Each dot represents the median intensity collected from one retina. Numbers of samples analyzed are shown in the graph (data from 12 independent retinal sections from 2 eyes). *** p < 0.005; **** p < 0.001 (one-sided Student’s t-test). d The distribution of Prox1 in the retinas of mice with heterozygous and homozygous rd10 mutations in Pde6b gene (Pde6brd10) was investigated by immunostaining. MG cells among Prox1-positive cells were determined by co-staining of Prox1 and Sox2. Boxed areas in top row are magnified in the next three rows. Sox2-positive MG nuclei are outlined by dotted-lines. e Prox1 intensity in Sox2-positive MG relative to other retinal neurons in the same image is presented in the graph. Numbers of samples analyzed are shown in the graph (data from 4 independent litters). ** p < 0.01; *** p < 0.005; **** p < 0.001 (one-sided Student’s t-test). fPde6brd10/rd10;Glast-CreERT;R26tdTom/+ mice were intravitreally injected with AAV2-Ctrl Ab or AAV2-αProx1 at P10, followed by Tam injection to activate the CreERT, resulting in the expression of tdTom Cre reporter in MG. Mice were also injected with EdU daily from P33 to P38 to label cells born during last 6 days before sample collection at P39. g The identities of tdTom-expressing MG cell lineage cells in mouse retinas were investigated by co-immunostaining for cell type-specific markers. Immunostaining images are provided in Supplementary Fig. 15f, except for the rPR marker, Rhodopsin. The birth of these cells between P33 and P39 was determined by EdU-labeling. Boxed areas in top row are magnified in the next rows. White arrowhead points EdU-labeled cell rPR nuclei and black arrowhead indicates EdU-labeled cell nucleus in the choroid. h Mean numbers of cells expressing corresponding markers in the retinal area are provide in the graph. Numbers of samples analyzed are shown in the graph (data collected from 4 independent litters). i Visual acuities of the mice measured at the indicated postnatal days. *, p < 0.05; **, p < 0.01 (one-sided Student’s t-test) Error bars in the graphs represent SEM (n = 8; 5 independent litters).

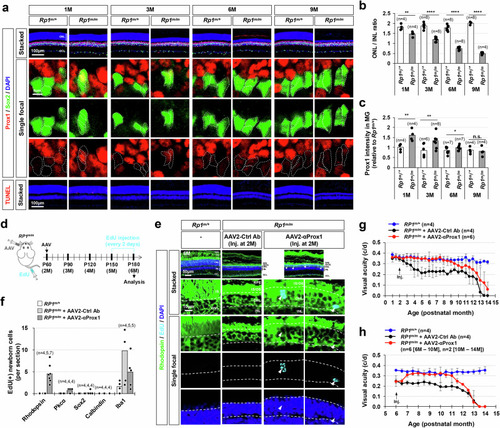
Vision recovery in late-onset RP model mice by viral gene delivery of anti-Prox1 antibody.

(a) The distribution of Prox1 in the retinas of mice with heterozygous and homozygous tvrm64 mutation of Rp1 gene (Rp1m) was investigated by immunostaining. MG cells among Prox1-positive cells were determined by co-staining of Prox1 and Sox2. Boxed areas in top row are magnified in the next three rows. Sox2-positive MG nuclei are outlined by dotted-lines. (b) The thicknesses of the ONL and INL of the retinal sections were measured and relative thickness of the ONL compared to the INL of the same retinal sections is presented in the graph. **, p < 0.01; ****, p < 0.001 (One-sided Student’s t-test). (c) Relative Prox1 immunofluorescent intensity in MG in the corresponding retina, normalized to Prox1 intensity in BCs within the same image, is shown. Each dot represents the median intensity collected from one retina (data from 3 independent litters). **, p < 0.01; ***, p < 0.005; ****, p < 0.001 (One-sided Student’s t-test). (d) Rp1m/m mice were intravitreally injected with AAV2-Ctrl Ab or AAV2-αProx1 at P60, and then with EdU every 2 days for one month before sample collection to label the cells born around the injection time points. (e) The identities of these EdU-labeled cells in mouse retinas were investigated by co-immunostaining for cell type-specific markers. Immunostaining images are provided in Supplementary Fig. 19f, except for the rPR marker Rhodopsin. Boxed areas in top row are magnified in the next rows. Arrowheads, EdU-labeled cells containing Rhodopsin. (f) Number of cells expressing corresponding markers (data collected from 2 independent litters). (g) Visual acuities of the mice infected with AAV at 2 months of age (2 M) and measured at the indicated postnatal months. Error bars in the graphs represent SEM (3 independent litters). (h) Visual acuities of the mice infected with AAV at 6 M and measured at the indicated postnatal months. Error bars in the graphs represent SEM (3 independent litters).

Acknowledgments
This image is the copyrighted work of the attributed author or publisher, and ZFIN has permission only to display this image to its users. Additional permissions should be obtained from the applicable author or publisher of the image. Full text @ Nat. Commun.