IMAGE

Fig. 6

ID
ZDB-IMAGE-250331-19
Source
Figures for Lee et al., 2025
Image
Figure Caption

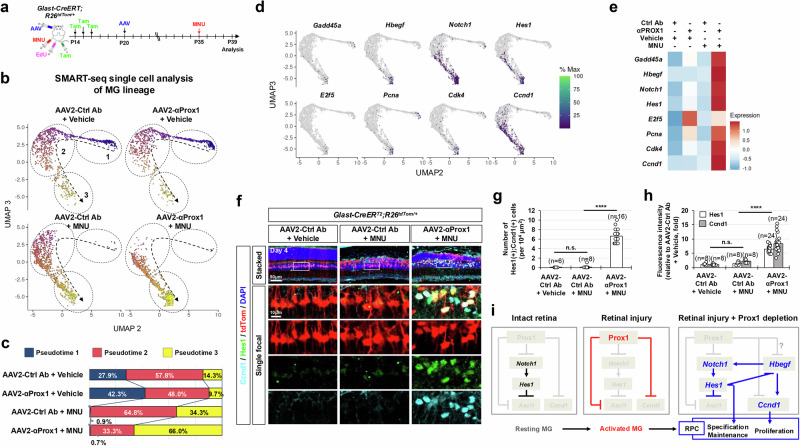
Fig. 6 Injury-induced reprogramming of MG into RPCs upon reduced Prox1 transfer.

a Retinas from Glast-CreERT;R26tdTom/+ mice infected with AAV2-Ctrl Ab or AAV2-αProx1 were injured using MNU. MG lineage cells were then purified by FACS at the indicated time points for SMART-seq analysis (ae) or analyzed by immunostaining for RPC markers (fh). b UMAP plots from Monocle 3 analysis of SMART-seq data for FACS-purified tdTom-positive cells in vehicle- or MNU-treated Glast-CreERT;R26tdTom/+ mouse retinas (details in Methods). Dotted arrows indicate pseudotime progression, with circled areas marking distinct populations by pseudotime intervals. c Pseudotime distributions of cell populations for each sample are shown. d Pseudotime distributions of cells expressing RPC and proliferative cell marker mRNAs are plotted. e Heatmap displaying the mean expression levels of the indicated mRNAs in each sample. f Distribution of Ccnd1 and Hes1 in AAV2-infected Glast-CreERT;R26tdTom/+ mouse retinas was assessed by immunostaining. Magnified views of boxed areas in the top row are shown in the subsequent rows. g, h Graphs show the number of Ccnd1 and Hes1 double-positive cells (g) and the relative intensity of Ccnd1 and Hes1 in these cells (h). Error bars denote SEM. ****, p < 0.001; n.s., > 0.05 (one-sided Student’s t-test). i A hypothetical model illustrating the negative regulation of injury-induced MG reprogramming into RPCs by Prox1.

Acknowledgments
This image is the copyrighted work of the attributed author or publisher, and ZFIN has permission only to display this image to its users. Additional permissions should be obtained from the applicable author or publisher of the image. Full text @ Nat. Commun.