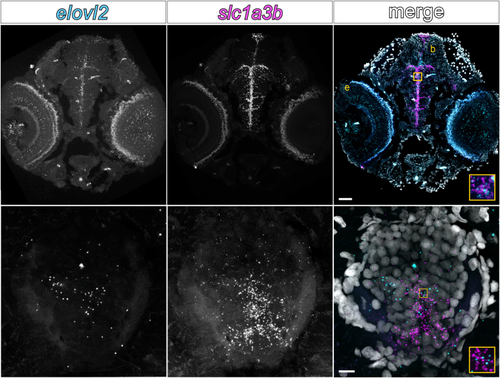
Zebrafish central nervous system tissues express elovl2 during development. RNA Fluorescent in situ hybridization performed on transverse sections of 4 dpf wild-type larvae. A: Head, showing elovl2 puncta in the eye (e) and brain (b), 50 μm scale bar. B: Spinal cord, 10 μm scale bar. Colocalization of elovl2 and slc1a3b (astrocyte/radial glia cell marker) transcripts in the brain and spinal cord supports existing single-cell RNA-seq data.

ZFIN is incorporating published figure images and captions as part of an ongoing project. Figures from some publications have not yet been curated, or are not available for display because of copyright restrictions.

Wild-type zebrafish fed a DHA-deficient diet have similar growth trajectories as fish fed DHA-sufficient diet. A: Average fish body mass, calculated by dividing total tank wet mass by the number of fish per tank. B: Average fish length (nose to caudal peduncle), calibrated to ruler in tank. Separate cohorts of fish were fed the assigned diets starting at either 30 or 60 dpf, indicated in the plots by square or circle symbols, respectively. The main effects of diet and time (weeks on diet) were analyzed by 2-way repeated measures ANOVAs for the 30 and 60 dpf cohorts separately. Body mass and length did not differ between the SUFF and DEF groups for either initiation age. As expected for developing zebrafish, body mass and length significantly increased with feeding duration (body mass: 30 dpf, P = 0.0048 and 60 dpf, P < 0.001; length: 30 dpf, P < 0.001 and 60 dpf, P < 0.001). Values are mean ± SEM. DEF, DHA-deficient diet; SUFF, DHA-sufficient diet; dpf, days post fertilization.

PHENOTYPE:
Fish:
Condition:
Observed In:
Stage Range: Days 30-44 to Adult

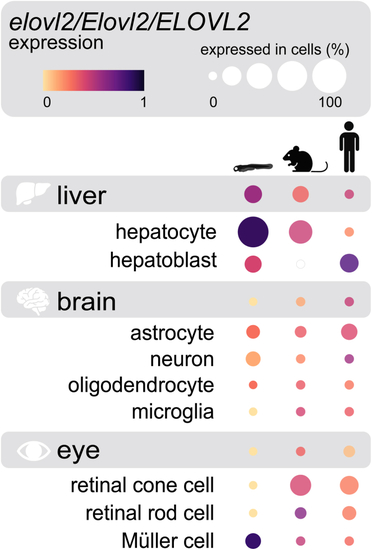
Zebrafish, mouse, and human central nervous system tissues express
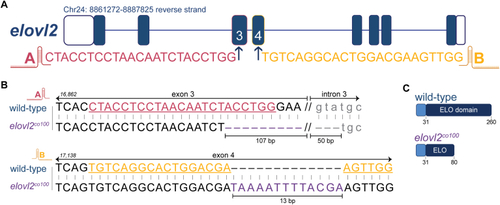
 elovl2/Elovl2/ELOVL2, respectively, a critical gene in the DHA biosynthesis pathway. In all three organisms, liver cells strongly express elovl2/Elovl2/ELOV2, whereas brain and eye cell-types express this gene at comparatively lower levels. Dot colors represent normalized expression levels (ranging from 0 to 1) for a particular organism, tissue, or cell-type. For each organism, expression comparisons can be made between tissues, eg, liver versus brain (grey boxes), as well as between cell-types within a given tissue, eg, astrocyte versus neuron. Dot sizes are scaled to indicate the percentage of each cell-type that expressed the gene of interest. Mouse and human expression patterns are from aggregated datasets submitted to the CZ CELLxGENE Discover platform (doi: 10.1101/2023.10.30.563174; https://cellxgene.cziscience.com/gene-expression). Zebrafish expression data (4 dpf larvae) are sourced from the Daniocell datasets and online resource (https://daniocell.nichd.nih.gov/index.html). Schematic design was inspired by the CZ CELLxGENE Discover online portal. Organism and tissue images were created using BioRender.com.

Generation of elovl2 mutant zebrafish with CRISPR/Cas9 genome editing. A: Schematic of the elovl2 gene and gRNA sequences, identified as targets A and B. B: Genomic sequences for wild-type elovl2 and one of the two generated mutant alleles, elovl2co100. Sequence peak tracings and PCR verification are shown in Supplemental Fig. 2. The elovl2co100 allele has a 157 bp deletion (107 bp in exon 3; 50 bp in intron 3) and 13 bp insertion in exon 4. C: Schematic of predicted Elovl2 protein in wild-type (260 AA) and elovl2co100 (80 AA) fish. Genomic and protein results for the second generated mutant allele (elovl2co101) are shown in Supplemental Fig. 1. All experiments were conducted using elovl2co100 mutants unless otherwise noted.

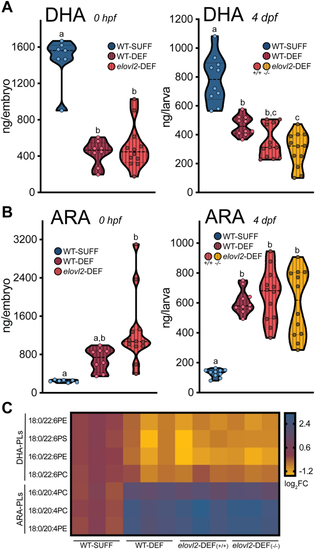
Maternal dietary DHA restriction and biosynthesis disruption depletes offspring DHA and increases ARA. Adult wild-type and elovl2+/− parents were fed either SUFF or DEF for 25–29 weeks prior to spawning. A: DHA and (B) ARA concentrations in 0 hpf embryos and 4 dpf larvae measured by GC/MS. Offspring from elovl2-DEF mothers had similar fatty acid status, regardless of +/+ or −/− genotype. Dots represent individually analyzed offspring (n = 6–12 fish/group). Groups labeled with different letters denote significant differences by 1-way ANOVA with Tukey’s post-hoc test (P < 0.05). C: Representative DHA-PL and ARA-PL species in 4 dpf larvae measured by LC/MS/MS (n = 3 pooled replicates/group; n = 3 larvae per pool). Values are log2(fold change) relative to the WT-SUFF group mean. DHA-PLs decreased and ARA-PLs increased in offspring from DEF-fed mothers compared to the WT-SUFF group. ARA, arachidonic acid; DHA, docosahexaenoic acid; PC, phosphatidylcholine; PE, phosphatidylethanolamine; PL, phospholipid; PS, phosphatidylserine.

DHA-restricted mothers produce offspring with a series of morphological phenotypes, and phenotype severity is related to offspring DHA and ARA status. A: Example 4 dpf larvae from each experimental group. The elovl2-DEF larva shown here is representative of the more severe morphological phenotype observed. This severe phenotype was characterized by the 4 abnormal features labeled in this panel. For both DEF groups, a series of phenotypes was observed between and within clutches, with some offspring exhibiting 1 to 3 of these features. For example, the WT-DEF larva in this panel has 3 of the 4 features (no pericardial edema). B: Proportion of offspring per clutch with or without severe morphological abnormalities at 4 dpf, expressed as a mean percentage ± SEM (n = 9–13 clutches/group, with n = 998–1638 larvae evaluated/group). Larvae were binned into the “severe” phenotype category if they exhibited ≥3 of the following abnormal features: small eyes, curved axis, uninflated swim bladder, and pericardial edema. The severe phenotype was most often observed in elovl2-DEF offspring (12% per clutch), followed by WT-DEF (4%) and WT-SUFF (0%). The elovl2-DEF “severe” defects bar (purple) is magnified to show that offspring genotype does not explain the phenotype; the proportions of elovl2 +/+ (29%) +/− (47%) and −/− (24%) larvae with severe defects follow the predicted 1:2:1 Mendelian ratios. Percentages were calculated from n = 130 genotyped larvae collected at 4 dpf, generated from 7 elovl2-DEF clutches. C: Offspring with severe phenotypes (≥3 abnormal features) have lower DHA and ARA status than their morphologically normal siblings. Dots represent individually analyzed larvae, generated from DEF-fed mothers for 20–42 weeks (n = 6–12 larvae/group). Two-tailed unpaired Student’s t-tests or Mann-Whitney tests were used when appropriate.

DHA-deficient elovl2 mutant offspring with abnormal eye morphologies exhibit disorganized retinal architecture. Immunofluorescent staining of representative 4 dpf larval eyes using transverse sections from (A) WT-SUFF, (B) WT-DEF, (C) morphologically normal elovl2-DEF, and (D) elovl2-DEF siblings with the severe morphological phenotype. Calretinin marks neuronal populations in the inner retinal layers. Zpr-1 labels cone photoreceptors of the outer sensory layer. Scale bar: 20 μm.

Offspring with low DHA status have dysregulated vision and stress response gene pathways. Morphologically normal 4 dpf larvae from wild-type mothers fed a DHA-sufficient diet (WT-SUFF) or elovl2+/−mothers fed a DHA-deficient diet (elovl2-DEF) were used for bulk RNA-seq (n = 3 replicates/group, n = 25 pooled whole larvae/replicate). A: Principal component analysis shows that samples in the same group cluster together. B: Volcano plot of differentially expressed genes in elovl2-DEF compared to WT-SUFF (290 genes). Dashed lines mark thresholds used to assess statistical significance (FDR-adjusted P-value <0.1, ≥ 2 fold change). C: Significantly down- (maroon) and up- (coral) regulated gene pathways identified from a Metascape pathway enrichment analysis using the 290 DEGs (hypergeometric test with Benjamini-Hochberg procedure for multiple comparisons).

ZFIN is incorporating published figure images and captions as part of an ongoing project. Figures from some publications have not yet been curated, or are not available for display because of copyright restrictions.

Acknowledgments
This image is the copyrighted work of the attributed author or publisher, and ZFIN has permission only to display this image to its users. Additional permissions should be obtained from the applicable author or publisher of the image. Full text @ J. Lipid Res.