
- Title
-
A high-cholesterol zebrafish diet promotes hypercholesterolemia and fasting-associated liver steatosis
- Authors
- Jin, Y., Kozan, D., Young, E.D., Hensley, M., Shen, M.C., Wen, J., Moll, T., Anderson, J.L., Kozan, H., Rawls, J.F., Farber, S.A.
- Source
- Full text @ J. Lipid Res.
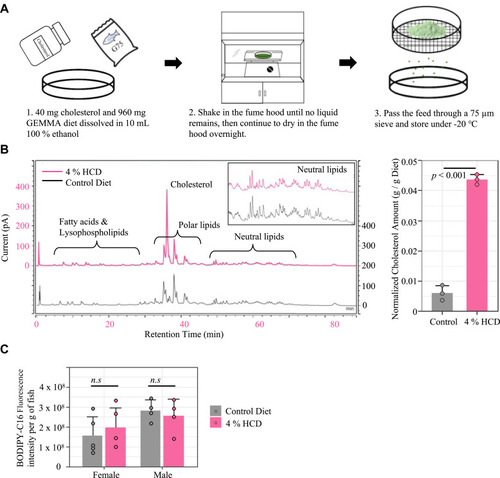
Diet-making protocol and quality control. A: Procedure for making the HCD. B: Quantification of lipids in diets using HPLC-CAD. The left figure shows representative chromatographs for extracted lipids from an HCD and the control diet. The bar graph on the right compares the cholesterol amount between HCD and the control diet (n = 3, mean ± SD, Welch t test). C: Comparison of food intake between fish fed HCD and control diet with 0.025% BODIPY-C16. Total fluorescence was measured from lipids extracted from the entire intestinal tract and liver of fish after 1 h of feeding (n > 4, mean ± SD, two-way ANOVA with Tukey HSD post hoc tests, n.s P > 0.05). HCD, high-cholesterol diet; HSD, honestly significant difference. |
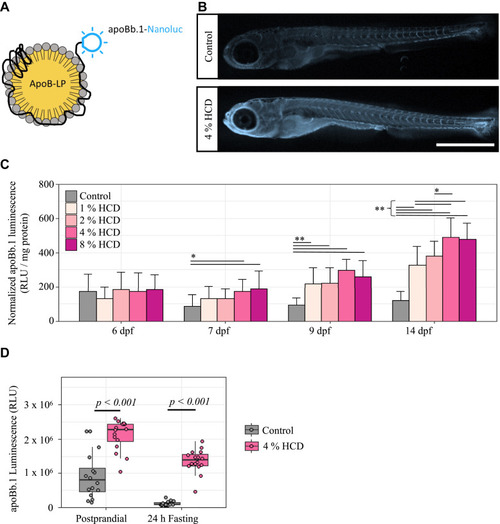
Effect of HCD on ApoB levels in zebrafish larvae. A: The LipoGlo reporter line, which contains an engineered apoBb.1 gene fused with a nanoluciferase reporter was used for quantifying ApoB-LP levels in fish (21). B: LipoGlo-imaging was used to monitor ApoB-nluc chemiluminescence in whole zebrafish larvae (14 dpf) fed either the control diet or 4% HCD. Twenty-three fish were sampled from each dietary group and a representative image is shown. Scale = 1 mm. C: LipoGlo-counting quantified whole-body ApoB-LP levels in each diet from initial feeding at 6–14 dpf. Each bar represents mean ± SD from 24 fish (robust two-way ANOVA with Games-Howell tests). ∗P < 0.05, ∗∗P < 0.001 D: Comparison of ApoB-LP levels (LipoGlo-counting) in fish fed the HCD and control diet at postprandial or 24 h-fasted stage (n = 16 fish each group, robust two-way ANOVA with Games-Howell tests). ApoB, apolipoprotein B; ApoB-LP, ApoB-containing lipoprotein; dpf, days post fertilization; HCD, high-cholesterol diet. |
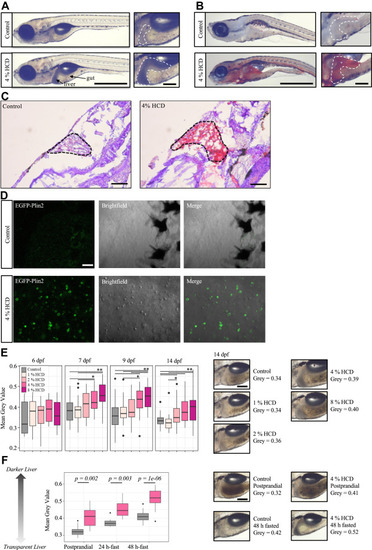
Effect of HCD on liver opacity of zebrafish larvae. A: Representative brightfield image of 14 dpf zebrafish larvae fed the control diet or 4% HCD from 6 dpf to 13 dpf followed by 24 h fasting (n > 20 fish per group). Scale = 1 mm. Scale for zoom image = 0.2 mm. B: Representative Oil-red-O staining image of 14 dpf zebrafish larvae fed the control diet or 4% HCD from 6 dpf to 13 dpf followed by 24 h fasting (n = 38 fish per group). Scale = 1 mm. Scale for zoom image = 0.2 mm. C: Representative Oil-red-O staining on slides of the zebrafish larvae fed the control diet or 4% HCD from 6 dpf to 13 dpf followed by 24 h fasting (n = 5 fish per group). Dotted line shows the liver region of the larvae. Scale = 0.1 mm. D: Confocal images of the liver of EGFP-Plin2 zebrafish, which express EGFP coding sequence fused to the N terminus of the endogenous plin2 gene. Representative images were taken from the livers of 14 dpf fish fed 4% HCD or control diet (n = 4 fish per group). Scale = 10 μm. E: Measurement of liver opacity in postprandial fish (2 h after latest meal) fed control diet, 1%, 2%, 4%, or 8% HCD. Two hundred individuals were used in total. Liver opacity was calculated by measuring the mean gray value of the marked liver area (representative figures shown on the right), which were then normalized by the mean gray value of the muscle area next to the liver. A robust two-way ANOVA with Games-Howell tests was used for statistical test. Details of the method are illustrated in supplemental Fig. S4. Scale = 0.2 mm. F: Effect of fasting on liver opacity. Fish were fed either the control diet (gray) or 4% HCD (pink) from 6 dpf to 13 dpf, followed by either continued feeding or fasting for 24 h or 48 h. Liver opacity was calculated using the same method as D: A robust two-way ANOVA with Games-Howell tests was used for statistical test. Figures of the other two experiments are shown in supplemental Fig. S5. Scale = 0.2 mm. ∗P < 0.05, ∗∗P < 0.001. dpf, days post fertilization; HCD, high-cholesterol diet; Plin2, perilipin 2. |
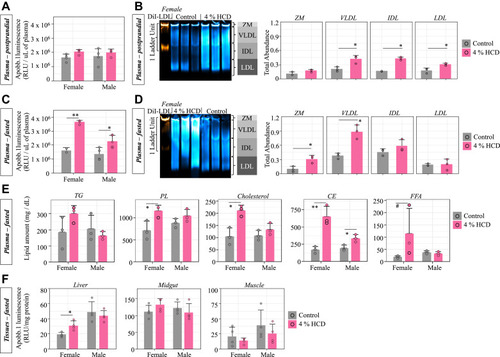
Effect of HCD on plasma ApoB-LP levels and plasma and liver lipids compositions of adult fish. A: LipoGlo-counting for measuring total ApoB-LP in plasma of postprandial fish fed the control diet or 4% HCD for 2 weeks (mean ± SD, two-way ANOVA with Tukey’s post hoc tests). B: The gel figure is LipoGlo-electrophoresis (a Native-PAGE assay to separate the ApoB-LP based on size) on 3 representative female plasmas from each diet (mean ± SD, student t-tests). Image is a composite of chemiluminescent (LipoGlo, blue) and fluorescent (DiI-LDL, orange) exposures. ApoB-LPs are separated into 4 classes based on mobility, including zero mobility (ZM), very-low-density lipoproteins (VLDLs), intermediate-density lipoproteins (IDLs), and low-density lipoprotein (LDL). The ZM fraction is a cluster of species above a certain size threshold, including chylomicrons and chylomicron remnants (21). Gel is a representative image from one of the three independent experiments performed. C: LipoGlo-Counting (mean ± SD, two-way ANOVA with Tukey’s post hoc tests). D: LipoGlo-Electrophoresis (mean ± SD, student t-tests) on plasma samples from fish fed the control diet and 4% HCD, followed by a 3-days fasting period. E: Quantification of major lipid classes in fasted zebrafish plasma using HPLC-CAD platform. A robust two-way ANOVA with Games-Howell tests was used for statistical test. F: LipoGlo-Counting for measuring total ApoB-LP in homogenized liver, gut, or muscle tissues of fasted fish after being fed the control diet or 4% HCD (mean ± SD, robust two-way ANOVA with Games-Howell tests). ∗P < 0.05, ∗∗P < 0.001, #P = 0.07. ApoB, apolipoprotein B; ApoB-LP, ApoB-containing lipoprotein; HCD, high-cholesterol diet. |
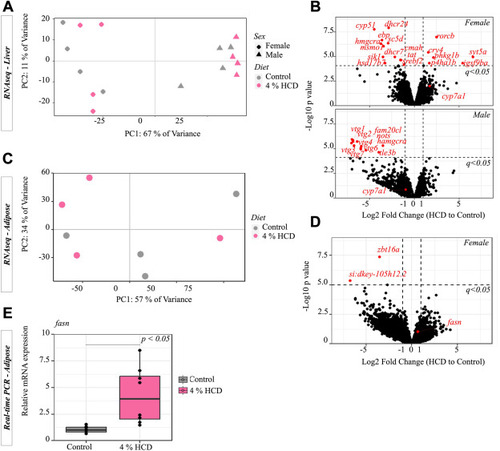
Gene expression analysis on adipose and liver of zebrafish fed 4% HCD and control diet followed by 3 days of fasting. A: Transcriptomic (RNAseq) analysis on the liver of fish fed 4% HCD compared to the control diet. The panel shows the score plot of PCA on log2 count per million (CPM) of the top 500 most variant genes across all 16 fish. B: DEGs (q < 0.05 and |Log2FC| > 1) between the livers of fish of each gender fed 4% HCD compared to the control diet. C: Transcriptomic analysis on the adipose tissue of fish fed 4% HCD compared to the control diet. The panel shows the score plot of PCA across all samples (4 individuals x 2 diets). D: DEGs between the livers of fish fed 4% HCD and the control diet. E: RT-PCR measurement of fasn gene expression (relative to control) in adipose tissue. Each diet group contains 8 individual fish samples (n = 8) collected from two independent experiments (Welch t test). DEGs, differentially expressed genes; HCD, high-cholesterol diet; PCA, principal component analysis. |
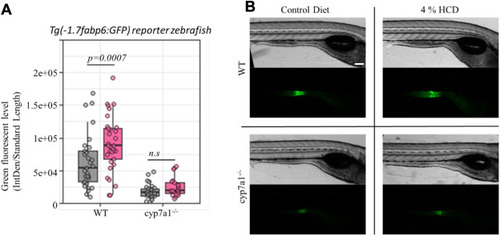
Effect of 4% HCD on bile acid signaling in zebrafish. A: Total green fluorescent protein fluorescence level in Tg(-1.7fabp6:GFP) reporter zebrafish with or without cyp7a1 mutation fed either 4% or the control diet. As fabp6 is an Fxr target, regulated by bile salts in zebrafish, this result suggests that our HCD could be used for modulating bile salt signaling in zebrafish. B: Representative brightfield and fluorescent images of WT and cyp7a1 mutant larvae fed either control diet or 4 % HCD. Two-way robust ANOVA and Games–Howell test were used for all samples. Scale = 0.2 mm. Fxr, farnesoid X receptor; HCD, high-cholesterol diet. |