
|
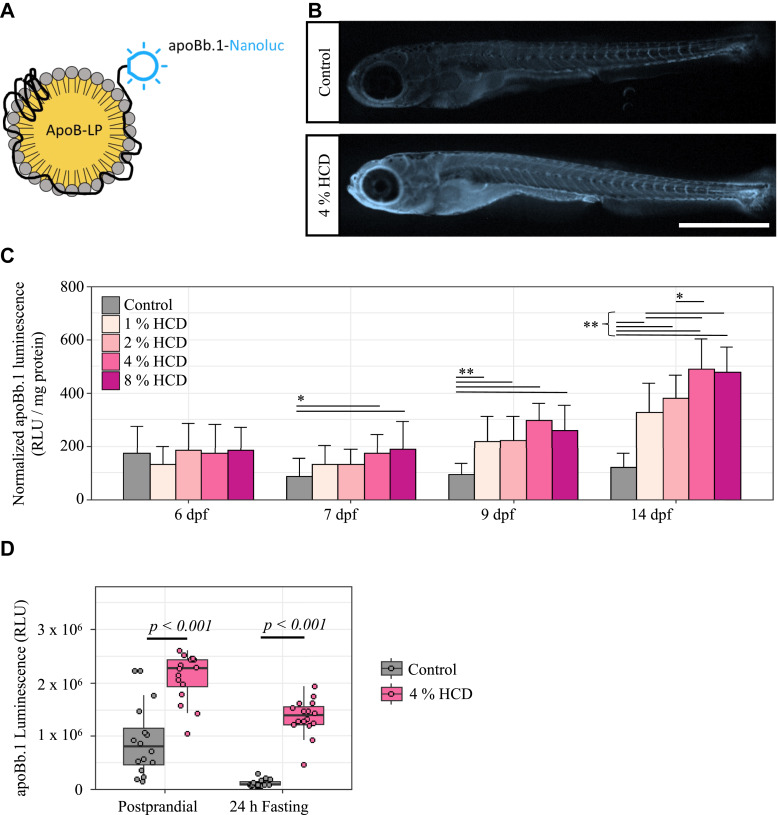
Fig. 2 Effect of HCD on ApoB levels in zebrafish larvae. A: The LipoGlo reporter line, which contains an engineered apoBb.1 gene fused with a nanoluciferase reporter was used for quantifying ApoB-LP levels in fish (21). B: LipoGlo-imaging was used to monitor ApoB-nluc chemiluminescence in whole zebrafish larvae (14 dpf) fed either the control diet or 4% HCD. Twenty-three fish were sampled from each dietary group and a representative image is shown. Scale = 1 mm. C: LipoGlo-counting quantified whole-body ApoB-LP levels in each diet from initial feeding at 6–14 dpf. Each bar represents mean ± SD from 24 fish (robust two-way ANOVA with Games-Howell tests). ∗P < 0.05, ∗∗P < 0.001 D: Comparison of ApoB-LP levels (LipoGlo-counting) in fish fed the HCD and control diet at postprandial or 24 h-fasted stage (n = 16 fish each group, robust two-way ANOVA with Games-Howell tests). ApoB, apolipoprotein B; ApoB-LP, ApoB-containing lipoprotein; dpf, days post fertilization; HCD, high-cholesterol diet.