
|
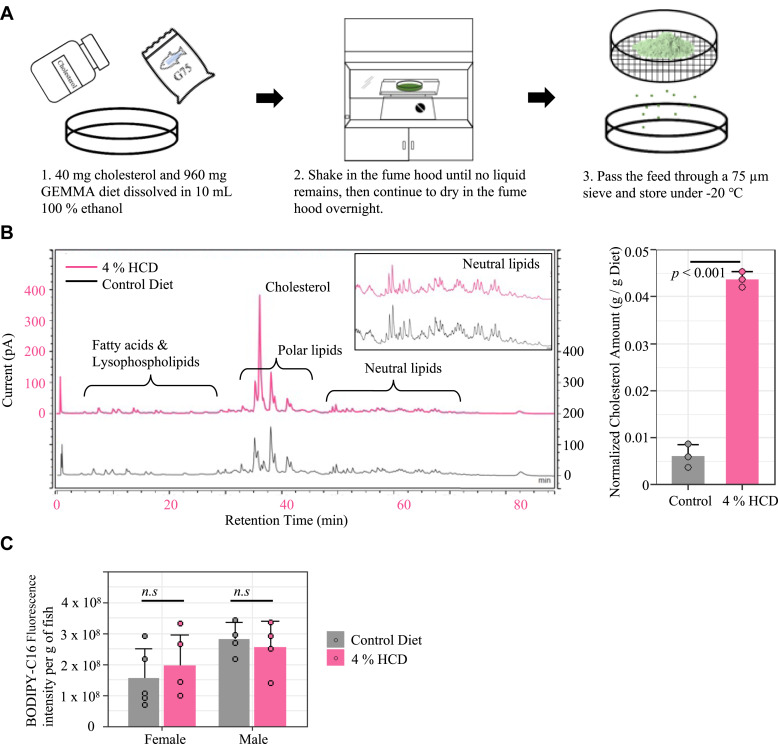
Fig. 1 Diet-making protocol and quality control. A: Procedure for making the HCD. B: Quantification of lipids in diets using HPLC-CAD. The left figure shows representative chromatographs for extracted lipids from an HCD and the control diet. The bar graph on the right compares the cholesterol amount between HCD and the control diet (n = 3, mean ± SD, Welch t test). C: Comparison of food intake between fish fed HCD and control diet with 0.025% BODIPY-C16. Total fluorescence was measured from lipids extracted from the entire intestinal tract and liver of fish after 1 h of feeding (n > 4, mean ± SD, two-way ANOVA with Tukey HSD post hoc tests, n.s P > 0.05). HCD, high-cholesterol diet; HSD, honestly significant difference.