
- Title
-
A retroviral link to vertebrate myelination through retrotransposon-RNA-mediated control of myelin gene expression
- Authors
- Ghosh, T., Almeida, R.G., Zhao, C., Mannioui, A., Martin, E., Fleet, A., Chen, C.Z., Assinck, P., Ellams, S., Gonzalez, G.A., Graham, S.C., Rowitch, D.H., Stott, K., Adams, I., Zalc, B., Goldman, N., Lyons, D.A., Franklin, R.J.M.
- Source
- Full text @ Cell
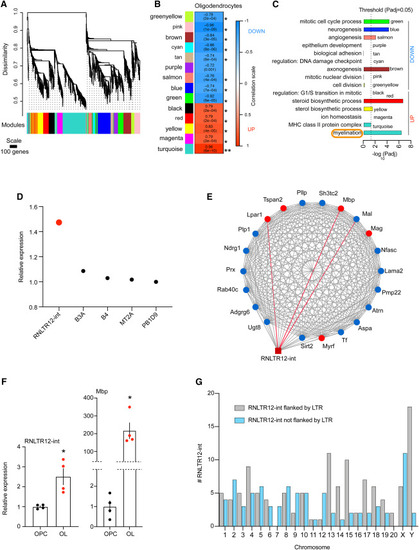
Network analyses of differentially expressed retrotransposons and protein coding genes in oligodendrocytes (A) Cluster dendrogram and derived modules (color labeled) after WGCNA. Modules are clusters of genes that are highly connected based on co-expression relations of their expression values across OPC and OL (see STAR Methods for details). Probe-level meta-analysis of Affymetrix microarray data (GEO: GSE245032) was performed, and normalized intensity values were used as input in WGCNA (see STAR Methods for details). (B) Association of modules with oligodendrocytes is determined by WGCNA. ∗p < 0.0007 (Bonferroni threshold). p value in parentheses, correlation is written above, and the box is color coded according to the color scale on the left. (C) GO terms that are significantly overrepresented in modules. p adj: adjusted p value (Benjamini-Hochberg false discovery rate [FDR]). Up and down: indicate the modular gene expression changes (elevated or repressed, respectively) in OL compared with OPC. (D) Expression changes (OL vs. OPC) of retrotransposons in turquoise module were plotted, as determined by microarray. p adj (Benjamini-Hochberg FDR) < 0.01. (E) Potential interaction of RNLTR12-int with myelination gene-network. Protein-coding genes in the network are represented by round-shaped nodes, and RNLTR12-int is represented by a brown square. Top five hubs (genes which have topmost connectivity in the network) are represented by red nodes and the rest nodes are colored blue, edges (lines) represent connection (based on expression correlation) between two nodes. Red edges: top three edges (topmost strong connections with RNLTR12-int). (F) Expressions of RNLTR12-int transcript and Mbp in OL and OPC were determined using RT-qPCR and relative expressions compared with OPC were plotted. Data normalized to Actb. n = 4 (P7 rats), mean ± SEM, ∗p < 0.05, Student’s t test (unpaired, two tailed). (G) Total number of RNLTR12-int (either flanked or not flanked by LTR) per chromosome in rats that were identified by our criteria (see STAR Methods) is plotted as a bar diagram. See also Figures S1, S2, and S3. |
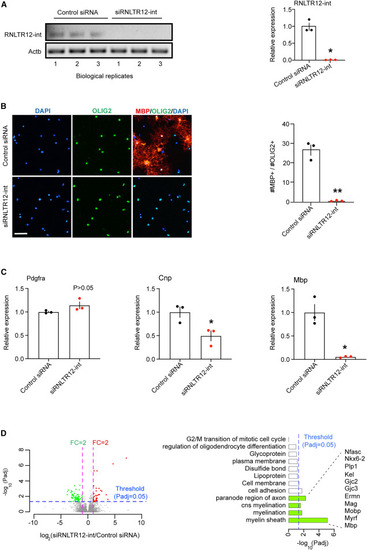
Inhibition of RNLTR12-int expression affects Mbp expression (A) RNLTR12-int expression was inhibited upon transfection of siRNA against RNLTR12-int (siRNLTR12-int) as determined by RT-PCR. PCR products were run on a 2% agarose gel (left). RT-qPCR analysis (right). Data were normalized to cytoplasmic beta-actin (Actb). Control siRNA: siGENOME non-targeting siRNA pool (Dharmacon). n = 3 independent experiments (each time 4 P7 brains were pooled for OPC isolation), mean ± SEM, ∗p < 0.05, Student’s t test (unpaired, two tailed) with Welch’s correction. (B) Left: immunofluorescence analysis using antibody to OLIG2 (oligodendrocyte lineage-specific marker) and to MBP (differentiation/maturation marker). Upon transfection, OPCs were maintained in differentiation media for 5 days. Scale bars, 60 μm. Right: quantification of matured OLs (MBP+ and OLIG2+), presented as a percentage of total OLIG2+ cells. n = 3 independent experiments (each time three replicates), mean ± SEM, ∗∗p < 0.0001, two-way ANOVA. (C) Effect of the inhibition of RNLTR12-int on RNA-level expression of Pdgfra, Cnp, and Mbp was determined by RT-qPCR. Data were normalized to Actb. n = 3 independent experiments, mean ± SEM, ∗p < 0.05, Student’s t test (unpaired, two tailed) with Welch’s correction. (D) Global changes of gene expression due to inhibition of RNLTR12-int in differentiating OPC as determined by RNA-seq (GEO: GSE237744). Left: volcano plot representing differential expression, up- (red dot) and downregulated (green dot) genes. Right: GO-term overrepresented in differentially expressed genes. p adj: adjusted p value (Benjamini-Hochberg FDR after Wald test). Genes involved in myelination (green bars) are downregulated. n = 4 (control siRNA), 3 (siRNLTR12-int) independent experiments. See also Figures S4 and S5. |
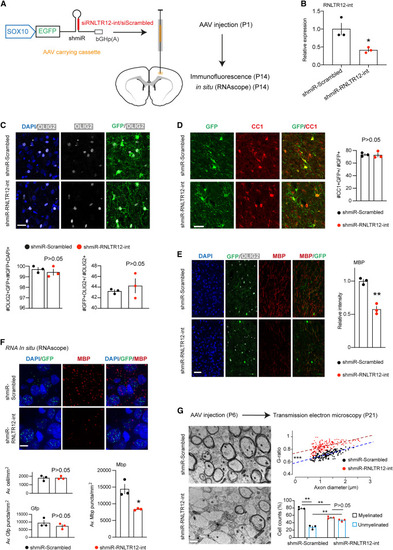
Inhibition of RNLTR12-int expression affects Mbp expression during developmental myelination in rats (A) SOX10-driven Emerald GFP (EGFP) construct that carry shmiR where shRNA is embedded into a microRNA (miR-30) cassette. bGHp(A): bovine growth hormone poly(A) signal. This construct is SOX10 driven and expresses EGFP. This also produces shRNA that function through RNAi pathway. AAV-carrying SOX10-EGFP-shmiR-RNLTR12-int/scrambled constructs were injected into the deep cortex of rat at P1, and brains were harvested at P14. (B) AAV carrying the above construct were infected into the cultured OPC and allowed to differentiate for 4 days, then RNA was isolated. RT-qPCR analysis of RNLTR12-int revealed its reduced expression in shmiR-RNLTR12-int-infected cells. n = 3 independent experiments, mean ± SEM, ∗p < 0.05, Student’s t test (unpaired and two tailed). (C–F) AAV carrying the above construct (shown in A) were injected into newborn rat brain (at P1). Brains were harvested at P14 for immunofluorescence (C–E) or in situ (RNAscope) (F). (C) Top: immunofluorescence analysis of OLIG2 and GFP immunostaining. Bottom left: quantification of OLIG2+GFP+ cells were plotted as a percentage of GFP+DAPI+ cells. Bottom right: quantification of OLIG2+GFP+ cells were plotted as a percentage to OLIG2+ cells. (D) Left: immunofluorescence analysis of CC1 and GFP immunostaining. Right: quantification of CC1+GFP+ cells among GFP+ cells and represented as a percentage. (E) Left: immunofluorescence analysis using antibody to MBP, GFP, and OLIG2. Right: MBP intensities were quantified and plotted relative to shmiR-scrambled-infected samples. (C–E) n = 3 different rats, mean ± SEM, ∗∗p < 0.01, Student’s t test (unpaired and two tailed). Scale bars, 22 μm. (F) Top: RNA in situ (using RNAscope technique) analyses of Mbp and Gfp puncta. Scale bars, 11 μm. Bottom: average number of cells, Gfp and Mbp puncta counts per mm2 were plotted. n = 3 different rats, mean ± SEM, ∗p < 0.05, Student’s t test (unpaired and two tailed). (G) AAV carrying the above construct (shown in A) were injected into the corpus callosum of the newborn rat brain (at P6). Left: transmission electron microscopy (TEM) micrographs from rat brains (P21) injected with shmiR-Scrambled or shmiR-RNLTR12-int. Scale bars, 1 μm. Right (top): scatter plots representing G-ratio in relation to axon diameter. n = 183 (for shmiR-Scrambled) to 203 (shmiR-RNLTR12-int) axons from three different rats. The fitted linear regression lines were shown, and the statistical significance (ANCOVA) of their slope and intercepts difference were determined. For slope difference: p > 0.05, indicating that the relation between G-ratio and the axon diameter does not change due to inhibition of RNLTR12-int. For intercept difference: ∗∗∗p < 2 × 10⁻¹⁶, indicating that axons of a given diameter have a significantly higher G-ratio in shmiR-RNLTR12-int compared with shmiR-Scrambled cases. Right (bottom): myelinated and unmyelinated axons were counted and plotted as a percentage. n = 3 different rats. Mean ± SEM ∗∗adjusted p < 0.01, two-way ANOVA (Bonferroni post test). See also Figure S5. |
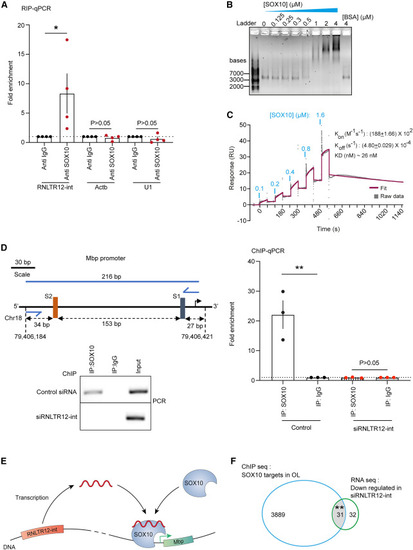
SOX10 binds to RNLTR12-int encoded transcript, and this is required for SOX10 binding to Mbp promoter (A) RT-qPCR after cross-linking RIP (from P7 rat brains) with SOX10 or control immunoglobulin G1, showing SOX10 association with RNLTR12-int transcript. n = 4 independent experiments (each time 5–6 brains were pooled). Mean ± SEM, ∗p < 0.05, ratio paired t test (two sided). U1: U1 spliceosomal small nuclear RNA. (B) SOX10 binds RNLTR12-int as determined by EMSA. Binding reactions contained RNLTR12-int transcript (3.4 nM) and increasing concentrations (0.125–4 μM) of SOX10. Complexes were separated on a 0.6% native agarose gel and detected by GelRed. (C) Binding kinetics of RNLTR12-int transcript and SOX10, analyzed by surface plasmon resonance (SPR). SOX10 protein was sequentially injected at five different concentrations (0.1–1.6 μM) over the streptavidin-coated flow cell sensor surface immobilized with 3′ end biotin-labeled RNLTR12-int or kept blank. Sensorgram of the single-cycle kinetics (SCK) represents the data corrected for non-specific binding to the flow cell surface (gray). The curve fit with 1:1 binding is shown (dark pink). (D) ChIP analyses with SOX10 or control immunoglobulin G1, 4 days after siRNA transfection, showing SOX10 occupancy to Mbp promoter is affected in absence of RNLTR12-int transcript. Left: (top) schematic representation of Mbp promoter. Rat genome assembly: rn6, FP, forward primer; RP, reverse primer for PCR amplification after ChIP. SOX10 binding conserved elements22: S2 (“AACAAT”) and S1 (“TTCAAA”). Black right arrow after S1: transcription start site (TSS). (Bottom) PCR-amplified immunoprecipitated DNA, run on 2% agarose gel. Right: qPCR analysis after ChIP. n = 3 independent experiments. Mean ± SEM, ∗∗p < 0.01, ratio paired t test (two sided). (E) Illustration represents SOX10-mediated transcription of Mbp is RNLTR12-int transcript dependent. Copies of RNLTR12-int exists in the rat genome. For simplicity reason, only one is drawn. RNLTR12-int is transcribed. Association of the transcription factor SOX10 to Mbp promoter requires a direct binding interaction between SOX10 and RNLTR12-int transcript. Green arrow: TSS. (F) In OL, only a fraction (0.8%) of SOX10 targets is downregulated upon RNLTR12-int inhibition. Venn diagram represents the overlap between SOX10 targets (ChIP-seq data: GEO: GSE64703) and the genes downregulated due to RNLTR12-int inhibition (RNA-seq data: GEO: GSE237744). ∗∗p < 0.0001, hypergeometric test. See also Figure S5. |
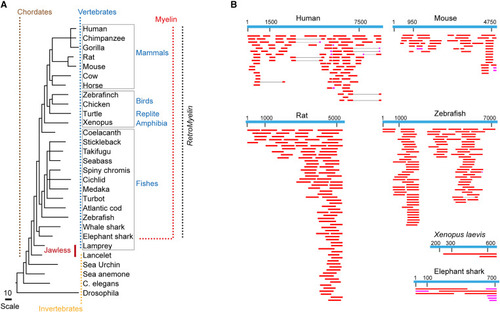
Phylogenetic relationship of RNLTR12-int and Mbp (A) Common tree display represents a hierarchical view of evolutionary relationships among taxa and their lineages. Appearance of myelin/MBP is associated with the gain of hinge-jaw in vertebrates1–3, 6. Presence of myelin/MBP1–3, 6 in most ancient living vertebrate (the cartilaginous fishes) (red dotted horizontal line) to higher vertebrates (red dotted vertical line) is marked. Black dotted vertical line marks the vertebrate classes wherever RetroMyelin is identified in our study. All identified RetroMyelin belong to the ERV1 family, carrying internal sequence of ERV1. (B) Expressed sequence tags (ESTs) were aligned to the RetroMyelin sequence of human, mouse, rats, zebrafish, Xenopus laevis, and elephant sharks. BLASTn was used to search ESTs. For the displayed ESTs: 0 < E value < 2.9e−18 and 100 < alignment score < 2,298. For human, mouse, rat, and zebrafish: consensus sequence was used. For elephant shark and Xenopus laevis: the best hit obtained after nhmmer search on RNLTR12-int (Table S1; see STAR Methods) was used. Magenta: alignment score ≥ 100, red: alignment score ≥ 200. See also Table S1. |
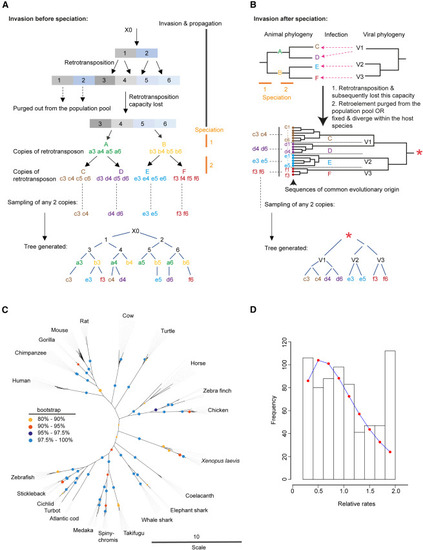
Acquisition of RetroMyelin in host genome occurred independently after each host’s final speciation, testifying convergent evolution (A) With a hypothetical example, here, we show that how a tree would look like if retroviral element acquisition occurred once before their speciation from the most recent common ancestor. A representation of a hypothetical phylogenetic tree reconstructed from copies of a specific retrotransposon sequence existing in different species. Let us assume that a viral invasion had happened before speciation. The newly invaded proviral genome (X0) generates copies 1 and 2 in a host genome. Subsequently retrotransposition of copy 1 propagated as copies 3 and 4, whereas copies 5 and 6 were generated from copy 2. Copies 3, 4, 5, and 6 completely lost their capacity to further retrotranspose due to mutations associated with each recombination event. Selective forces acting at the level of host population subsequently purge copies 1 and 2 from the population pool. Speciation then produces species A and B (speciation 1), and from these ancestors, C and D as well as E and F, respectively, are generated (speciation 2). Assume that each species received the versions of the original copy of 3, 4, 5, and 6 (represented by a, b, c, d, e, and f). A scientist collects samples of two copies (randomly) from each extant species (C, D, E, and F) for reconstruction of a phylogenetic tree. In the resulting tree, we can see that the phylogeny of the retrotransposon copies (c3, e3, f3, c4, d4, etc.) does not recapitulate the species tree, and the copies sampled from each species are not clustered together. (B) A hypothetical example (alternative to A) showing what a tree would look like if the acquisition of retroviral element occurred after each host’s final speciation. Similar to (A), speciation 1 followed by 2 generated species C, D, E, and F. Infection (dotted arrows) of retroviruses (V1 to V3) to the host animals (C, D, E, and F) then happened. Subsequently, some ERV copies were fixed in the species genome and underwent sequence divergence within the host species over the course of time. We can view the consequences of this incidence in the form of a sequence phylogeny with a common evolutionary origin (red star) somewhere back in time. This means that the ultimately derived sequences (colored dots) in species (C to F) are of common origin; therefore, they are homologous but not orthologous. Black dotted lines demarcate sequences determined from the three species. A scientist collects two random copies (similar color coded similar to A) from extant species (C to F) to reconstruct a phylogenetic tree with these sequences. We can observe that the copies sampled from each species are clustered together in the resulting tree. (C) Data from our study suggest RetroMyelin acquisition occurred after each host’s final speciation. Phylogenetic tree (inference based on maximum likelihood and bootstrapping) was reconstructed from the copies of RetroMyelin sequences from each species (for detail see STAR Methods). Copies of RetroMyelin in each species were clustered together, with high bootstrap support values throughout (colored circles) and particularly at host-species-defining branches. (D) RetroMyelin sequences have a common evolutionary origin (similar to the example shown in B) and therefore are suitable for evolutionary rate heterogeneity analysis that we present here (see STAR Methods for detail). Frequency of site-wise relative rates is represented as a histogram. Expected values of relative rate per bin were calculated from the cumulative distribution function of the inferred gamma distribution (the inferred shape parameter [α] = 2.224, standard error = 0.156) and plotted (red dots). See also STAR Methods. |
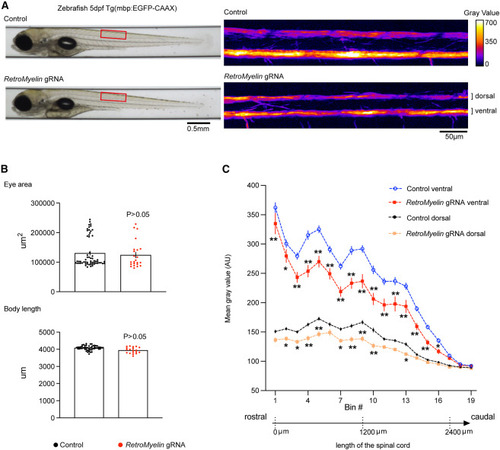
RetroMyelin regulates myelination in zebrafish Reduction of Mbp-promoter-driven EGFP expression upon genome editing of a small region of RetroMyelin sequences in a transgenic zebrafish reporter line (Tg(mbp:EGFP-CAAX) is shown. (A) Automated imaging of control and RetroMyelin gRNA injected zebrafish larva at 5 days postfertilization (5 dpf). Red boxes: locations of zoomed-in example regions in left panel. (B) No difference is found in larval morphological development, analyzed by eye area and body length. Adjusted p value after two-way ANOVA (Benjamini-Hochberg FDR post test), mean ± SEM, n = 52–60 (control), 19–23 (RetroMyelin gRNA) animals. (C) GFP fluorescence intensity along the dorsal and ventral tracts of the spinal cord was measured and plotted. ∗adjusted p < 0.05, ∗∗adjusted p < 0.01, two-way ANOVA (Benjamini-Hochberg FDR post test), mean ± SEM, n = 60 (control), 23 (RetroMyelin gRNA) animals. See also Figures S6 and S7. |
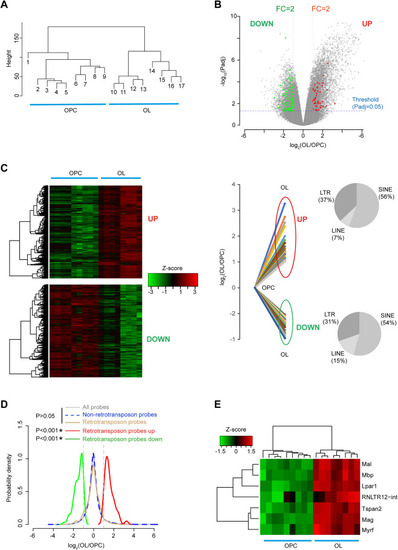
Genome-wide expression of retrotransposons in OPC and OL, related to Figure 1 (A) Dendrogram representation of OPC and OL samples, showing OPC and OL samples were formed two separate clusters. Average linkage hierarchical clustering (using Euclidean distance matrix) was performed with respect to the intensity levels of probes in Affymetrix GeneChip. (B) Probe level analysis of differential expression. Differentially expressed retrotransposons probes (red and green dots) and probes for protein-coding genes (gray dots). Probes for which the expression difference between OL and OPC is 2-fold up or down and the adjusted p < 0.05 were considered differentially expressed. FC, fold change; p adj, adjusted p value (Benjamini-Hochberg FDR). (C) Left: heatmap plot and dendrogram representation of all differentially expressed probes in OL and OPC samples. Right: differential gene expression (log2 value) of retrotransposon probes were plotted. UP: induced probes, DOWN: repressed probes. Proportion of different retrotransposon type in induced and repressed probes were plotted in a pie chart. (D) Probability density plots showing the behavior of retrotransposon probes, non-retrotransposon probes, all probes and differentially expressed retrotransposon probes. Vertical dotted lines: 2-fold change of expression. ∗p < 0.05, Wilcoxon rank sum test. (E) Expression levels of RNLTR12-int and myelination hubs were represented as a heatmap and a dendrogram derived after two-way hierarchical clustering. |
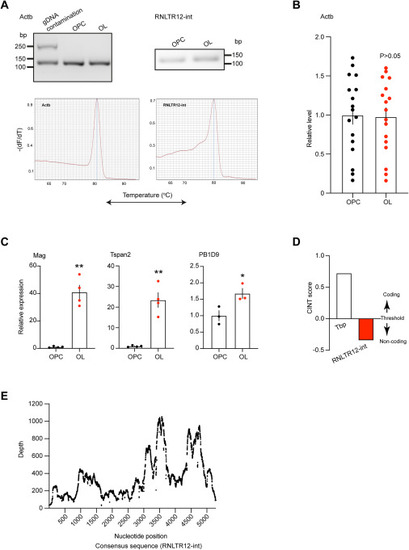
Validation of RNLTR12-int expression in MACS isolated OPC (A2B5+) and OL (Mog+), related to Figure 1 and STAR Methods (A) Top: (left) RT-PCR analysis of cytoplasmic beta-actin (Actb) using intron flanking primers. Example shown detection of gDNA contamination in RNA that resulted an upper band. Only single lower band obtained in OPC and OL samples, confirms no gDNA contamination. (right) RT-PCR analysis of RNLTR12-int expression in OPC and OL. PCR product was run on a 2% agarose gel. Bottom: qPCR melting curve analysis resulted only single peak for Actb (left) and RNLTR12-int (right). (B) Actb expressions remained unchanged in OPC and OL as determined by Affymetrix GeneChip. Normalized intensity of all Actb specific probes (17 probes) were used and plotted relative to OPC. Mean ± SEM; n = 9 (OPC), 8 (OL), p > 0.05, Student’s t test (unpaired, two tailed). (C) Expression levels of Mag, Tspan2, and PB1D9 is elevated in OL compared with OPC determined by RT-qPCR. Mean ± SEM; n = 3–4, ∗p < 0.05, ∗∗p < 0.01, Student’s t test (unpaired, two tailed). (D) RNLTR12-int encoded transcript is likely to be a non-coding RNA as predicted by Coding-Non-Coding Identifying Tool (CNIT) algorithm.65 Score of a known protein-coding gene, TATA-box binding protein (Tbp, Transcript ID: ENSRNOT00000002038.4) is shown. (E) RNA-seq reads (GEO: GSM3967160) were aligned to RNLTR12-int consensus sequence, and the depth was plotted. |
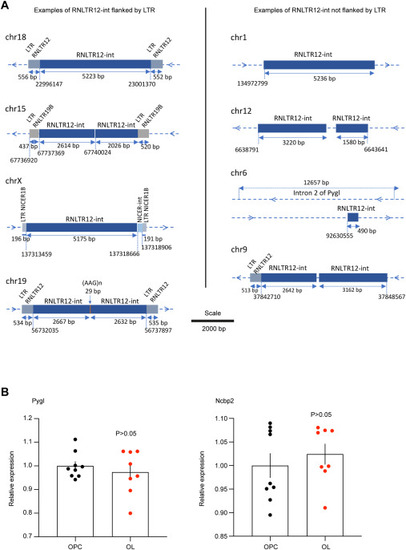
Some examples of RNLTR12-int copies in rat genome, related to Figure 1 and STAR Methods (A) Schematic view of some examples of RNLTR12-int in rat genome (rn6), which are flanked (A, left) or not flanked (A, right) by long terminal repeat (LTR). Length in base pair (bp) is written in the middle of the double headed arrow. Genomic location is mentioned below of a vertical dotted line. On each horizontal line the blue-colored symbol “>” indicates forward strand, “<” indicates reverse strand. chr, chromosome. (B) Expression levels of Pygl and Ncbp2 in OPC and OL (determined by Affymetrix GeneChip) were plotted relative to OPC samples. n = 9 (OPC), 8 (OL), mean ± SEM, p > 0.05, Student’s t test (unpaired, two tailed). |
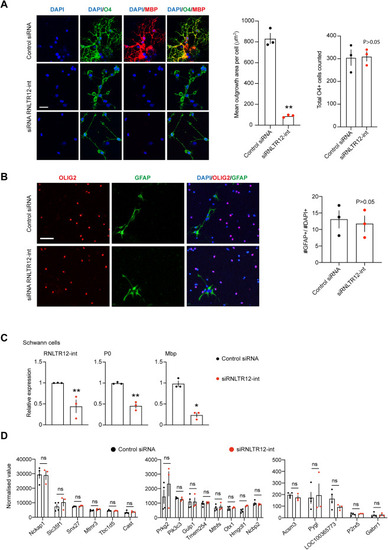
Functional impact of RNLTR12-int inhibition on oligodendrocyte morphology, cell fate, gene expression in Schwann cells, and elimination of any off-target effect, related to Figure 2 and STAR Methods (A) Absence of complex oligodendrocyte morphology due to inhibition of RNLTR12-int. Left: immunofluorescence analysis of O4 immunostaining 5 days after transfection of siRNA. Scale bars, 26 μm. siRNLTR12-int: siRNA against RNLTR12-int, control siRNA: siGENOME non-targeting siRNA pool (Dharmacon). Right: quantification of oligodendrocyte average outgrowth area (O4 immuno stained) and the total number of cells (O4 immuno positive) counted were plotted. Mean ± SEM, n = 3 independent experiments. ∗∗p < 0.01, Student’s t test with Welch’s correction (unpaired and two tailed). (B) Inhibition of RNLTR12-int did not initiate astrocytic fate. Immunofluorescence analysis of GFAP immunostaining 5 days after transfection of siRNA. Scale bars, 60 μm. Percentage of GFAP+ cell in total DAPI+ cells were plotted. n = 3 independent experiments (each time three replicates), mean ± SEM, p > 0.05, two-way ANOVA. siRNLTR12-int: siRNA against RNLTR12-int, control siRNA: siGENOME non-targeting siRNA pool (Dharmacon). (C) Effect of inhibition of RNLTR12-int on RNA-level expression of P0 and Mbp in Schwann sells (SCs). RNA-level expressions were determined by RT-qPCR. Upon transfection (siRNLTR12-int: siRNA against RNLTR12-int or control siRNA: siGENOME non-targeting siRNA pool [Dharmacon]), SC were maintained in differentiation media for 4 days, and RNA was harvested for RT-qPCR. n = 3 independent experiments (each time 2–3 replicates), mean ± SEM, ∗∗p < 0.01, ∗p < 0.05, two-way ANOVA. (D) Exclusion of any off-target effect. siRNA-mediated inhibition of RNLTR12-int in differentiating OPC does not alter expression of genes whose intronic region (either in the same or the opposite strand) contains fragment of RNLTR12-int. Normalized values from RNA-seq data plotted, mean ± SEM, ns: p > 0.05, Benjamini-Hochberg FDR after Wald test. |
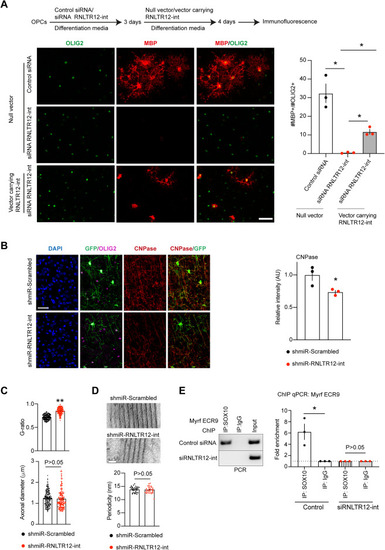
Effects of RNLTR12-int modulation on oligodendrocyte differentiation, myelination, and gene regulation, related to Figures 2, 3, and 4 (A) Overexpression of RNLTR12-int restores MBP expression in RNLTR12-int siRNA-silenced differentiating OPCs. pcDNA 3.1 (+) bearing a full-length RNLTR12-int consensus sequence or null vector was transfected 3 days after siRNA administration (schema above). Representative immune-stained image (left) and quantification of MBP+ oligodendrocytes (right) shown. ∗adjusted p < 0.05, Brown-Forsythe and Welch’s ANOVA (Benjamini-Hochberg FDR post test), mean ± SEM, n = 3 independent experiments. Scale bars, 45 μm. (B) CNPase expression is affected due to inhibition of RNLTR12-int during developmental myelination in rats. AAV carrying the construct (shown in Figure 3A) were injected into newborn rat brain (at P1). Brains were harvested at P14 for immunofluorescence. Left: immunofluorescence analysis using antibody to CNPase, GFP, and OLIG2. Right: CNPase intensities were quantified and plotted relative to shmiR-Scrambled-infected samples. n = 3 different rats, mean ± SEM, ∗p < 0.05, Student’s t test (unpaired and two tailed). Scale bars, 30 μm. (C and D) AAV carrying the construct (shown in Figure 3A) were injected to the corpus callosum at P6 rats and brains were harvested at P21 for TEM. (C) G-ratios but not the axonal diameters differ due to inhibition of RNLTR12-int. G-ratios (top) and axonal diameters (bottom) were plotted. n = 183 (for shmiR-Scrambled) to 203 (shmiR-RNLTR12-int) axons from three different rats. Mean ± SEM, ∗∗p < 0.0001, Student’s t test (unpaired and two tailed) with Welch’s correction. (D) Periodicity remained similar due to RNLTR12-int inhibition. TEM images shown (top). Scale bars, 20 nm. Bottom: average periodicity values were plotted. n = 35–36 myelin sheath images were used from three different rats. For each image an average of 2–5 different measurements were taken. Mean ± SEM, p > 0.05, Student’s t test (unpaired and two tailed). (E) SOX10 occupancy to Myrf promoter is affected due to inhibition of RNLTR12-int as determined by ChIP analysis 4 days after siRNA transfection. Left: SOX10 binding conserved region (ECR9)24 in the intron 1 of Myrf gene was PCR amplified (amplified region: chr1: 233229291–233229458 [rn5], strand: [−]) from the immunoprecipitated DNA and run on 2% agarose gel. Right: qPCR analysis after ChIP. n = 3 independent experiments. Mean ± SEM, ∗p < 0.05, ratio paired t test (two-sided). |
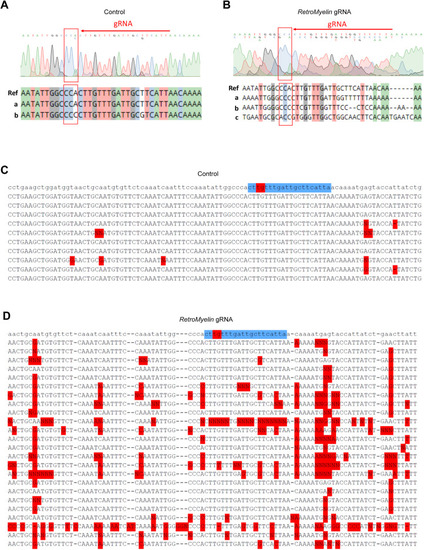
Assessing CRISPR-Cas9-mediated knockout in zebrafish injected with RetroMyelin gRNA, related to Figure 7 and STAR Methods (A and B) Example chromatograms from Sanger sequencing of a PCR product amplified from genomic DNA extracted from a control-injected larva (A) or RetroMyelin gRNA-injected larva (B) Predicted genomic sequence indicated on top, and gRNA target and PAM sequence indicated by red box and arrow. Below the traces are predicted alleles identified from the chromatograms using CRISP-ID,64 showing only few SNPs in control but multiple indels and variations in the gRNA-injected larva. (C and D) Alignments of the sequencing results for PCR products amplified from genomic DNA extracted from several control (C) or RetroMyelin gRNA-injected (D) larvae to the predicted genomic sequence (top, gRNA sequence in blue, and predicted cut site in red). Note widespread mismatches in RetroMyelin gRNA-injected traces, indicating gRNA activity. |
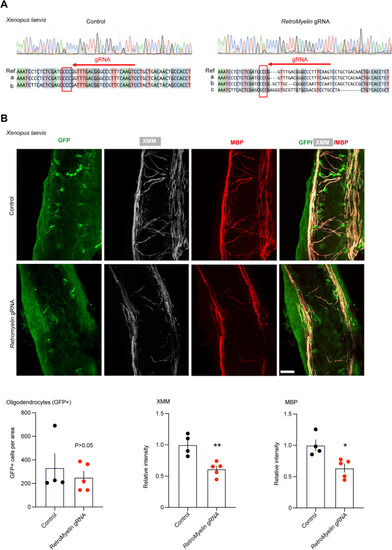
RetroMyelin regulates myelination in frog, related to Figure 7 (A) Analysis of overlapping peaks arising from control (left) or RetroMyelin gRNAs-injected Xenopus (right) using CRISP-ID.64 Shown is representative chromatogram from Sanger sequencing of PCR amplicons from genomic DNA extracted from control (left) or RetroMyelin gRNA-injected Xenopus tadpole (right). Alignments of sequences were generated from mixture sequences present in the same animal and compared with the reference sequence (Ref) for the target region. The direction of sgRNA binding site shown in red arrow. CCC (surround by a red rectangle) is the PAM sequence. Three sequences are detected in the injected animal, a: wild-type sequence, b: sequence with nucleotides mutations around the sgRNA target sequence, c: sequence with nucleotides mutations around the sgRNA and 5-bp nucleotides deletions). (B) Longitudinal Z-series of wholemount across the brain stem of Tg(mbp:gfp-ntr) control (upper) and RetroMyelin gRNAs-injected (RNLTR12−/−) (lower) Xenopus tadpoles triply labeled for GFP (green), MBP (red), and XMM (white) (Xenopus myelin marker [XMM]: mAb recognizes specifically an unknown Xenopus myelin protein89). Scale bars, 23 μm. Quantification of oligodendrocytes (GFP+ cells) was plotted. p > 0.05, Mann-Whitney test (two tailed), n = 4 (control), 5 (RetroMyelin gRNA) different sections, mean ± SEM. Intensity of XMM and MBP were quantified and plotted relative to control. ∗p < 0.05, Student’s t test (unpaired and two tailed), n = 4 (control), 5 (RetroMyelin gRNA) different sections. |
Reprinted from Cell, 187, Ghosh, T., Almeida, R.G., Zhao, C., Mannioui, A., Martin, E., Fleet, A., Chen, C.Z., Assinck, P., Ellams, S., Gonzalez, G.A., Graham, S.C., Rowitch, D.H., Stott, K., Adams, I., Zalc, B., Goldman, N., Lyons, D.A., Franklin, R.J.M., A retroviral link to vertebrate myelination through retrotransposon-RNA-mediated control of myelin gene expression, 814830.e23814-830.e23, Copyright (2024) with permission from Elsevier. Full text @ Cell