Fig. 1
- ID
- ZDB-FIG-240416-51
- Publication
- Ghosh et al., 2024 - A retroviral link to vertebrate myelination through retrotransposon-RNA-mediated control of myelin gene expression
- Other Figures
- All Figure Page
- Back to All Figure Page
|
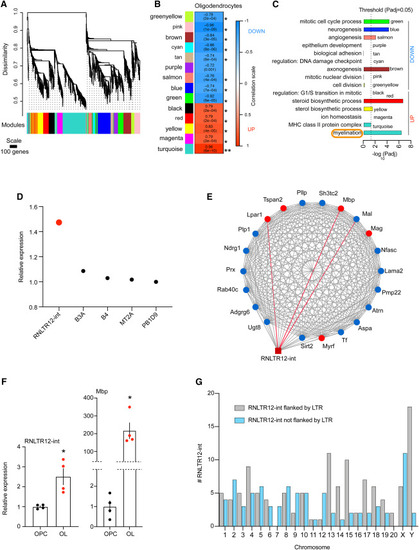
Network analyses of differentially expressed retrotransposons and protein coding genes in oligodendrocytes (A) Cluster dendrogram and derived modules (color labeled) after WGCNA. Modules are clusters of genes that are highly connected based on co-expression relations of their expression values across OPC and OL (see STAR Methods for details). Probe-level meta-analysis of Affymetrix microarray data (GEO: GSE245032) was performed, and normalized intensity values were used as input in WGCNA (see STAR Methods for details). (B) Association of modules with oligodendrocytes is determined by WGCNA. ∗p < 0.0007 (Bonferroni threshold). p value in parentheses, correlation is written above, and the box is color coded according to the color scale on the left. (C) GO terms that are significantly overrepresented in modules. p adj: adjusted p value (Benjamini-Hochberg false discovery rate [FDR]). Up and down: indicate the modular gene expression changes (elevated or repressed, respectively) in OL compared with OPC. (D) Expression changes (OL vs. OPC) of retrotransposons in turquoise module were plotted, as determined by microarray. p adj (Benjamini-Hochberg FDR) < 0.01. (E) Potential interaction of RNLTR12-int with myelination gene-network. Protein-coding genes in the network are represented by round-shaped nodes, and RNLTR12-int is represented by a brown square. Top five hubs (genes which have topmost connectivity in the network) are represented by red nodes and the rest nodes are colored blue, edges (lines) represent connection (based on expression correlation) between two nodes. Red edges: top three edges (topmost strong connections with RNLTR12-int). (F) Expressions of RNLTR12-int transcript and Mbp in OL and OPC were determined using RT-qPCR and relative expressions compared with OPC were plotted. Data normalized to Actb. n = 4 (P7 rats), mean ± SEM, ∗p < 0.05, Student’s t test (unpaired, two tailed). (G) Total number of RNLTR12-int (either flanked or not flanked by LTR) per chromosome in rats that were identified by our criteria (see STAR Methods) is plotted as a bar diagram. See also Figures S1, S2, and S3. |
Reprinted from Cell, 187, Ghosh, T., Almeida, R.G., Zhao, C., Mannioui, A., Martin, E., Fleet, A., Chen, C.Z., Assinck, P., Ellams, S., Gonzalez, G.A., Graham, S.C., Rowitch, D.H., Stott, K., Adams, I., Zalc, B., Goldman, N., Lyons, D.A., Franklin, R.J.M., A retroviral link to vertebrate myelination through retrotransposon-RNA-mediated control of myelin gene expression, 814830.e23814-830.e23, Copyright (2024) with permission from Elsevier. Full text @ Cell

