
Fig. 3
- ID
- ZDB-FIG-240416-57
- Publication
- Ghosh et al., 2024 - A retroviral link to vertebrate myelination through retrotransposon-RNA-mediated control of myelin gene expression
- Other Figures
- All Figure Page
- Back to All Figure Page
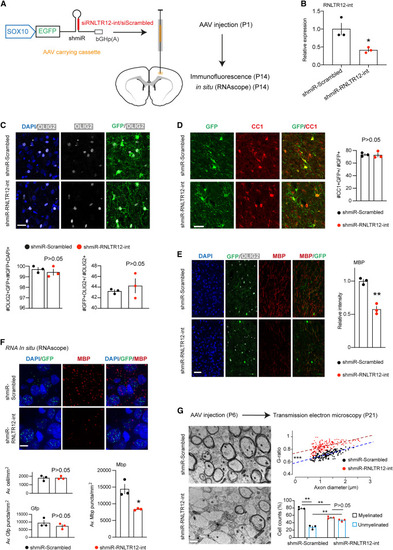
Inhibition of RNLTR12-int expression affects Mbp expression during developmental myelination in rats (A) SOX10-driven Emerald GFP (EGFP) construct that carry shmiR where shRNA is embedded into a microRNA (miR-30) cassette. bGHp(A): bovine growth hormone poly(A) signal. This construct is SOX10 driven and expresses EGFP. This also produces shRNA that function through RNAi pathway. AAV-carrying SOX10-EGFP-shmiR-RNLTR12-int/scrambled constructs were injected into the deep cortex of rat at P1, and brains were harvested at P14. (B) AAV carrying the above construct were infected into the cultured OPC and allowed to differentiate for 4 days, then RNA was isolated. RT-qPCR analysis of RNLTR12-int revealed its reduced expression in shmiR-RNLTR12-int-infected cells. n = 3 independent experiments, mean ± SEM, ∗p < 0.05, Student’s t test (unpaired and two tailed). (C–F) AAV carrying the above construct (shown in A) were injected into newborn rat brain (at P1). Brains were harvested at P14 for immunofluorescence (C–E) or in situ (RNAscope) (F). (C) Top: immunofluorescence analysis of OLIG2 and GFP immunostaining. Bottom left: quantification of OLIG2+GFP+ cells were plotted as a percentage of GFP+DAPI+ cells. Bottom right: quantification of OLIG2+GFP+ cells were plotted as a percentage to OLIG2+ cells. (D) Left: immunofluorescence analysis of CC1 and GFP immunostaining. Right: quantification of CC1+GFP+ cells among GFP+ cells and represented as a percentage. (E) Left: immunofluorescence analysis using antibody to MBP, GFP, and OLIG2. Right: MBP intensities were quantified and plotted relative to shmiR-scrambled-infected samples. (C–E) n = 3 different rats, mean ± SEM, ∗∗p < 0.01, Student’s t test (unpaired and two tailed). Scale bars, 22 μm. (F) Top: RNA in situ (using RNAscope technique) analyses of Mbp and Gfp puncta. Scale bars, 11 μm. Bottom: average number of cells, Gfp and Mbp puncta counts per mm2 were plotted. n = 3 different rats, mean ± SEM, ∗p < 0.05, Student’s t test (unpaired and two tailed). (G) AAV carrying the above construct (shown in A) were injected into the corpus callosum of the newborn rat brain (at P6). Left: transmission electron microscopy (TEM) micrographs from rat brains (P21) injected with shmiR-Scrambled or shmiR-RNLTR12-int. Scale bars, 1 μm. Right (top): scatter plots representing G-ratio in relation to axon diameter. n = 183 (for shmiR-Scrambled) to 203 (shmiR-RNLTR12-int) axons from three different rats. The fitted linear regression lines were shown, and the statistical significance (ANCOVA) of their slope and intercepts difference were determined. For slope difference: p > 0.05, indicating that the relation between G-ratio and the axon diameter does not change due to inhibition of RNLTR12-int. For intercept difference: ∗∗∗p < 2 × 10⁻¹⁶, indicating that axons of a given diameter have a significantly higher G-ratio in shmiR-RNLTR12-int compared with shmiR-Scrambled cases. Right (bottom): myelinated and unmyelinated axons were counted and plotted as a percentage. n = 3 different rats. Mean ± SEM ∗∗adjusted p < 0.01, two-way ANOVA (Bonferroni post test). See also Figure S5. |
Reprinted from Cell, 187, Ghosh, T., Almeida, R.G., Zhao, C., Mannioui, A., Martin, E., Fleet, A., Chen, C.Z., Assinck, P., Ellams, S., Gonzalez, G.A., Graham, S.C., Rowitch, D.H., Stott, K., Adams, I., Zalc, B., Goldman, N., Lyons, D.A., Franklin, R.J.M., A retroviral link to vertebrate myelination through retrotransposon-RNA-mediated control of myelin gene expression, 814830.e23814-830.e23, Copyright (2024) with permission from Elsevier. Full text @ Cell