
- Title
-
Interplay of Zeb2a, Id2a, and Batf3 regulates microglia and dendritic cell development in the zebrafish brain
- Authors
- Nguyen, T.M.L., Hassan, S., Pan, H., Wu, S., Wen, Z.
- Source
- Full text @ Development
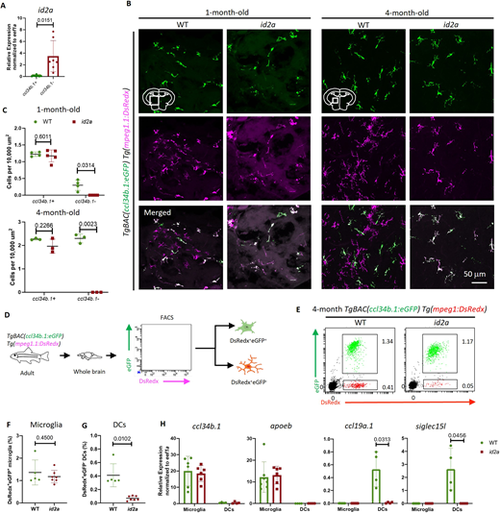
Brain-associated DCs are absent in the id2a-deficient mutants. (A) RT-PCR shows the expression levels of id2a in the ccl34b.1+ (GFP+DsRedx+) and ccl34b.1− (GFP−DsRedx+) cells sorted from 4-month-old TgBAC(ccl34b.1:eGFP);Tg(mpeg1.1:DsRedx) fish. n=7 for each group. (B,C) Representative images (B) and quantification (C) of the density of GFP+DsRedx+ and GFP−DsRedx+ cells in the transverse midbrain sections of 1-month-old and 4-month-old TgBAC(ccl34b.1:eGFP);Tg(mpeg1.1:DsRedx) WT or id2a mutant fish. n≥3 for each genotype. (D) Schematic of whole-brain FACS analysis of 4-month-old TgBAC(ccl34b.1:eGFP);Tg(mpeg1.1:DsRedx) WT fish and id2a mutants. ccl34b.1+mpeg1.1+ (DsRedx+eGFP+) and ccl34b.1−mpeg1+ (DsRedx+eGFP−) cells represent microglia and brain-associated DCs in WT, respectively. (E-G) Representative FACS plot (E) and the proportion (F,G) of ccl34b.1+mpeg1.1+ (DsRedx+eGFP+) and ccl34b.1−mpeg1+ (DsRedx+eGFP−) cells are presented as a percentage of total brain cells in TgBAC(ccl34b.1:eGFP);Tg(mpeg1.1:DsRedx) WT or id2a mutant brains. n=6 for WT and n=7 for id2a mutants. (H) RT-PCR shows the expression levels of microglia marker genes (ccl34b.1, apoeb) and brain-associated DC marker genes (ccl19a.1, siglec15l) in ccl34b.1+mpeg1.1+ and ccl34b.1−mpeg1.1+ cells collected from the brains of 4-month-old TgBAC(ccl34b.1:eGFP);Tg(mpeg1.1:DsRedx) WT or id2a mutants. n=6 for each genotype. Data are mean±s.d. Unpaired Student's t-test with Welch's correction. |
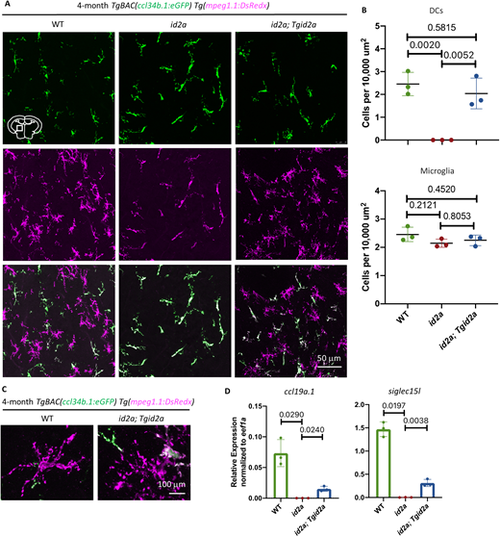
id2a is cell-autonomously required for the development of brain-associated DCs. (A,B) Representative images (A) and quantification (B) of the ccl34b.1−mpeg1.1+ cells (upper panel) and ccl34b.1+mpeg1.1+ (lower panel) cells in the transverse midbrain sections of 4-month-old TgBAC(ccl34b.1:eGFP);Tg(mpeg1.1:DsRedx) WT fish, id2a mutants or Tg(mpeg1.1:id2a);id2a (id2a; Tgid2a) transgenic mutants. The location of the imaging area is indicated by the box in the midbrain diagram. The ccl34b.1+ cells are GFP+DsRedx+ double positive, whereas ccl34b.1− cells are DsRedx+ single positive. n=3 for each group. (C) Representative images of ccl34b.1−mpeg1.1+ cells in the transverse brain sections of 4-month-old TgBAC(ccl34b.1:eGFP);Tg(mpeg1.1:DsRedx) WT fish, id2a mutants or id2a; Tgid2a transgenic mutants. (D) RT-PCR shows the expression levels of DC marker genes (ccl19a.1 and siglec15l) in ccl34b.1−mpeg1.1+ DCs sorted from the brains of 3-month-old TgBAC(ccl34b.1:eGFP);Tg(mpeg1.1:DsRedx) WT fish, id2a mutants or id2a; Tgid2a transgenic mutants. n=3 for each group. Data are mean±s.d. Unpaired Student's t-test with Welch's correction. |
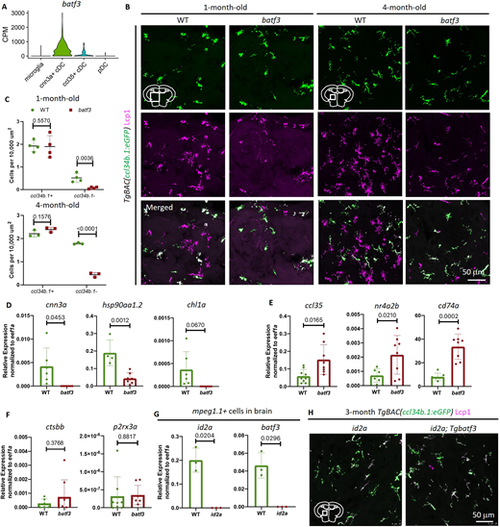
batf3 is downstream of id2a and required for cnn3a+ DC subset development. (A) Normalized expression of batf3 in cnn3a+ cDCs, ccl35+ cDCs and pDCs from the scRNA-seq dataset. (B,C) Representative images (B) and quantification (C) of the density of the ccl34b.1+ (GFP+Lcp1+) and ccl34b.1− (GFP−Lcp1+) cells in the transverse midbrain sections of 1-month-old and 4-month-old TgBAC(ccl34b.1:eGFP) WT or batf3 mutant fish. The total myeloid cells in the brain were visualized using anti-Lcp1 staining, which labels both microglia and brain-associated DCs in a WT background. n≥3 for each genotype. (D-F) RT-PCR shows the expression levels of cnn3a+ DC-specific markers (cnn3a, hsp90aa1.2 and chl1a) (D), ccl35+ DC-specific markers (ccl35, nr4a2b and cd74a) (E) and pDC-specific markers (ctsbb and p2rx3a) (F) in ccl34b.1−mpeg1.1+ cells sorted from the brains of 4-month-old TgBAC(ccl34b.1:eGFP);Tg(mpeg1.1:DsRedx) WT or batf3 mutant fish. n≥6 for each group. (G) RT-PCR shows the expression levels of id2a (left) and batf3 (right) in the mpeg1.1+ cells sorted from the brains of 5-month-old Tg(mpeg1.1:DsRedx) WT or id2a mutant fish. n=3 for each genotype. (H) Midbrain transverse sections of 4-month-old TgBAC(ccl34b.1:eGFP);id2a or Tg(mpeg1.1:batf3);id2a (id2a; Tgbatf3) transgenic mutants. The location of imaging is indicated by the box in the midbrain diagram. The microglia are marked by GFP+ and brain-associated DCs are Red+ single positive cells visualized by anti-Lcp1 staining, which labels both microglia and brain-associated DCs in a WT background. Data are mean±s.d. Unpaired Student's t-test with Welch's correction. |
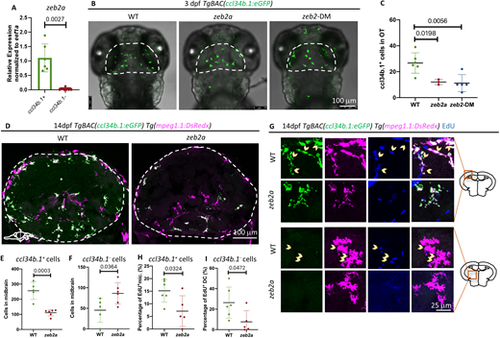
zeb2a promotes the proliferation of microglia. (A) RT-PCR showing the expression levels of zeb2a in the ccl34b.1+ (GFP+DsRedx+) and ccl34b.1− (GFP−DsRedx+) cells sorted from the brains of 4-month-old TgBAC(ccl34b.1:eGFP);Tg(mpeg1.1:DsRedx) fish. n=7 for each group. (B,C) Representative images (B) and quantification (C) of ccl34b.1+ cells in the optic tectum of 3 dpf TgBAC(ccl34b.1:eGFP) WT embryos, zeb2a single mutants and zeb2a/b double mutants (zeb2-DM). The optic tectum is indicated by dashed lines. n≥3 for each genotype. (D-F) Representative images (D) and quantification of ccl34b.1+mpeg1.1+ (GFP+DsRedx+) (E) and ccl34b.1−mpeg1.1+ (GFP−DsRedx+) (F) cells in the transverse midbrain sections of 14 dpf TgBAC(ccl34b.1:eGFP);Tg(mpeg1.1:DsRedx) WT or zeb2a mutant fish. The brain region is indicated by the dashed line. n=5 and 6 for WT and zeb2a mutants, respectively. (G-I) Representative images (G) and quantification of EdU+ ccl34b.1+mpeg1.1+ (GFP+DsRedx+) (H) and EdU+ ccl34b.1−mpeg1.1+ (GFP−DsRedx+) (I) cells in the transverse midbrain sections of 13 dpf TgBAC(ccl34b.1:eGFP);Tg(mpeg1.1:DsRedx) WT or zeb2a mutant fish. n=6 and 5 for WT and zeb2a mutants, respectively. Data are mean±s.d. Unpaired Student's t-test with Welch's correction. |
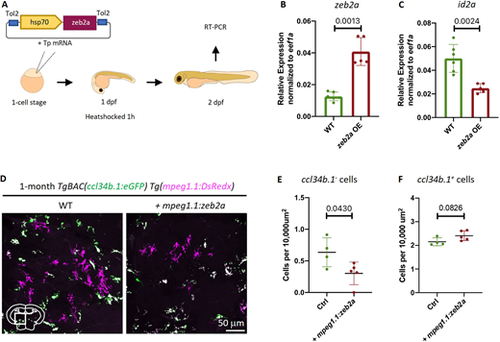
zeb2a inhibits DC development through repressing id2a expression. (A) Experimental design of zeb2a overexpression. The embryos injected with hsp70:zeb2a constructs and Tol2 transposase (TP) mRNA were heat-shocked at 1 dpf to induce the zeb2a expression. The heat-shocked embryos were collected at 2 dpf for RT-PCR analysis. (B,C) RT-PCR shows the expression levels of zeb2a and id2a in the whole embryo of 2 dpf WT and zeb2a-overexpressed fish. n=4 for each group. (D-F) Representative images (D) and quantification of the ccl34b.1+mpeg1.1+(GFP+DsRedx+) (F) and ccl34b.1−mpeg1.1+ (GFP−DsRedx+) cells (E) and their density in the transverse midbrain sections of 1-month-old TgBAC(ccl34b.1:eGFP);Tg(mpeg1.1:DsRedx) WT or mpeg1.1:zeb2a-injected fish. n=4 and 5 for WT and mpeg1.1:zeb2a-injected fish, respectively. Data are mean±s.d. Unpaired Student's t-test with Welch's correction |