
|
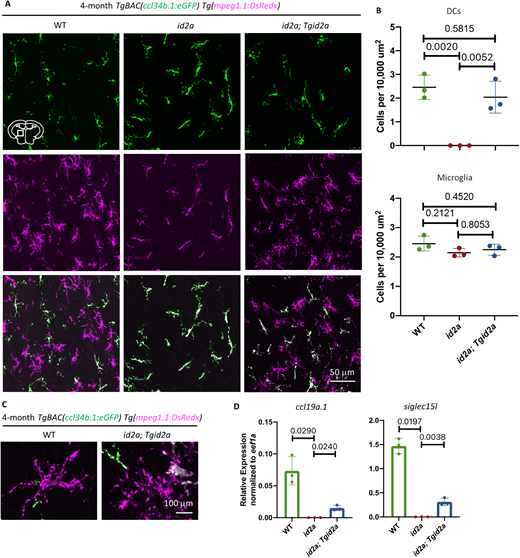
Fig. 2 id2a is cell-autonomously required for the development of brain-associated DCs. (A,B) Representative images (A) and quantification (B) of the ccl34b.1−mpeg1.1+ cells (upper panel) and ccl34b.1+mpeg1.1+ (lower panel) cells in the transverse midbrain sections of 4-month-old TgBAC(ccl34b.1:eGFP);Tg(mpeg1.1:DsRedx) WT fish, id2a mutants or Tg(mpeg1.1:id2a);id2a (id2a; Tgid2a) transgenic mutants. The location of the imaging area is indicated by the box in the midbrain diagram. The ccl34b.1+ cells are GFP+DsRedx+ double positive, whereas ccl34b.1− cells are DsRedx+ single positive. n=3 for each group. (C) Representative images of ccl34b.1−mpeg1.1+ cells in the transverse brain sections of 4-month-old TgBAC(ccl34b.1:eGFP);Tg(mpeg1.1:DsRedx) WT fish, id2a mutants or id2a; Tgid2a transgenic mutants. (D) RT-PCR shows the expression levels of DC marker genes (ccl19a.1 and siglec15l) in ccl34b.1−mpeg1.1+ DCs sorted from the brains of 3-month-old TgBAC(ccl34b.1:eGFP);Tg(mpeg1.1:DsRedx) WT fish, id2a mutants or id2a; Tgid2a transgenic mutants. n=3 for each group. Data are mean±s.d. Unpaired Student's t-test with Welch's correction.