
Fig. 1
- ID
- ZDB-FIG-240409-22
- Publication
- Nguyen et al., 2024 - Interplay of Zeb2a, Id2a, and Batf3 regulates microglia and dendritic cell development in the zebrafish brain
- Other Figures
- All Figure Page
- Back to All Figure Page
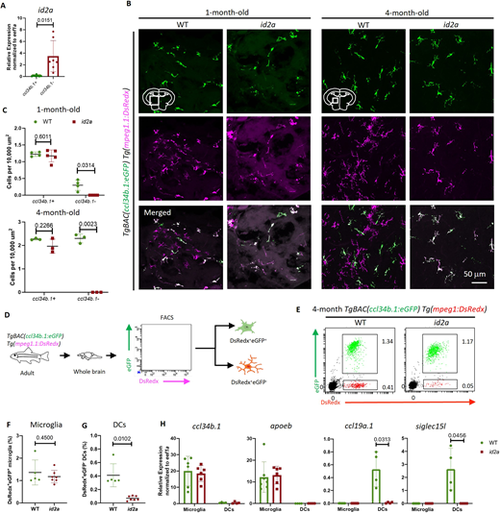
Brain-associated DCs are absent in the id2a-deficient mutants. (A) RT-PCR shows the expression levels of id2a in the ccl34b.1+ (GFP+DsRedx+) and ccl34b.1− (GFP−DsRedx+) cells sorted from 4-month-old TgBAC(ccl34b.1:eGFP);Tg(mpeg1.1:DsRedx) fish. n=7 for each group. (B,C) Representative images (B) and quantification (C) of the density of GFP+DsRedx+ and GFP−DsRedx+ cells in the transverse midbrain sections of 1-month-old and 4-month-old TgBAC(ccl34b.1:eGFP);Tg(mpeg1.1:DsRedx) WT or id2a mutant fish. n≥3 for each genotype. (D) Schematic of whole-brain FACS analysis of 4-month-old TgBAC(ccl34b.1:eGFP);Tg(mpeg1.1:DsRedx) WT fish and id2a mutants. ccl34b.1+mpeg1.1+ (DsRedx+eGFP+) and ccl34b.1−mpeg1+ (DsRedx+eGFP−) cells represent microglia and brain-associated DCs in WT, respectively. (E-G) Representative FACS plot (E) and the proportion (F,G) of ccl34b.1+mpeg1.1+ (DsRedx+eGFP+) and ccl34b.1−mpeg1+ (DsRedx+eGFP−) cells are presented as a percentage of total brain cells in TgBAC(ccl34b.1:eGFP);Tg(mpeg1.1:DsRedx) WT or id2a mutant brains. n=6 for WT and n=7 for id2a mutants. (H) RT-PCR shows the expression levels of microglia marker genes (ccl34b.1, apoeb) and brain-associated DC marker genes (ccl19a.1, siglec15l) in ccl34b.1+mpeg1.1+ and ccl34b.1−mpeg1.1+ cells collected from the brains of 4-month-old TgBAC(ccl34b.1:eGFP);Tg(mpeg1.1:DsRedx) WT or id2a mutants. n=6 for each genotype. Data are mean±s.d. Unpaired Student's t-test with Welch's correction. |