
- Title
-
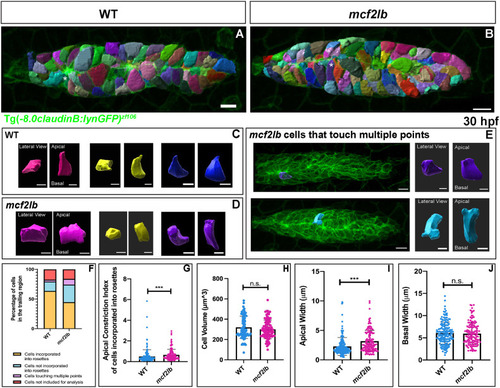
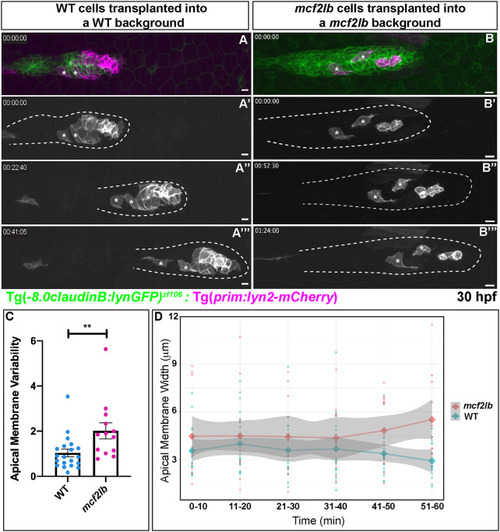
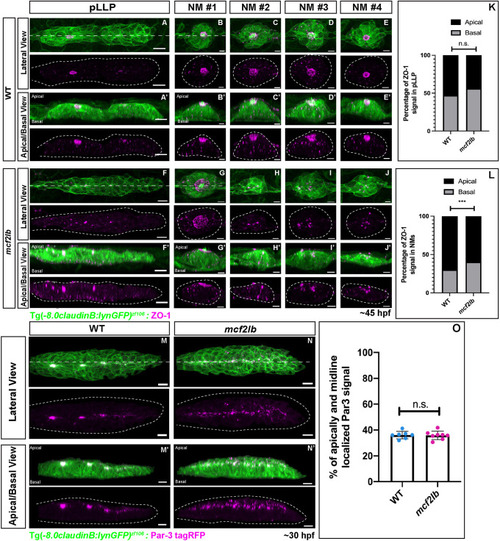
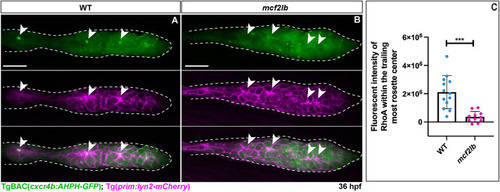
RhoA GEF Mcf2lb regulates rosette integrity during collective cell migration
- Authors
- Olson, H.M., Maxfield, A., Calistri, N.L., Heiser, L.M., Qian, W., Knaut, H., Nechiporuk, A.V.
- Source
- Full text @ Development
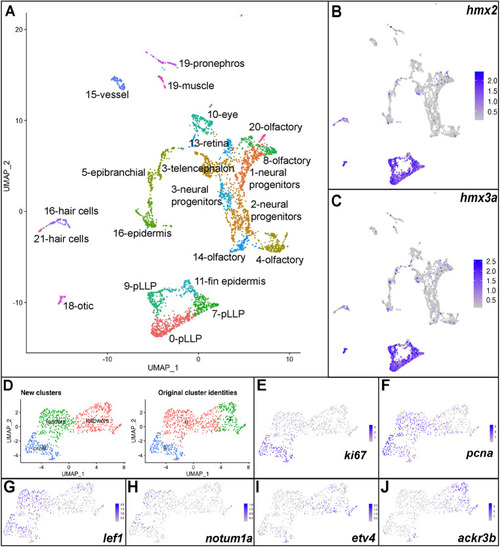
EXPRESSION / LABELING:
|
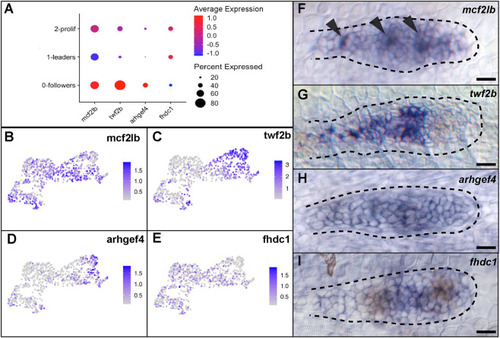
EXPRESSION / LABELING:
|
EXPRESSION / LABELING:
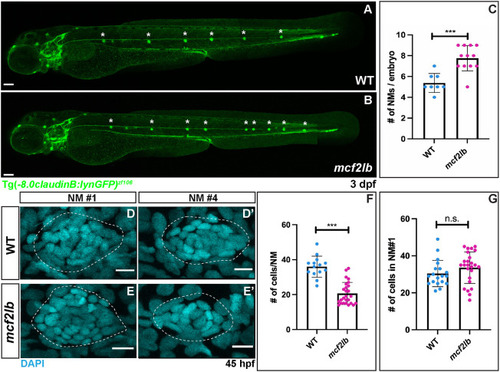
PHENOTYPE:
|
|
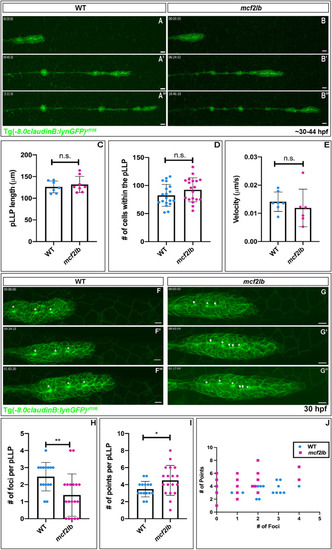
|
|
|
|

|