IMAGE

Fig. 6.

ID
ZDB-IMAGE-240129-250
Source
Figures for Olson et al., 2024
Image
Figure Caption

Fig. 6.

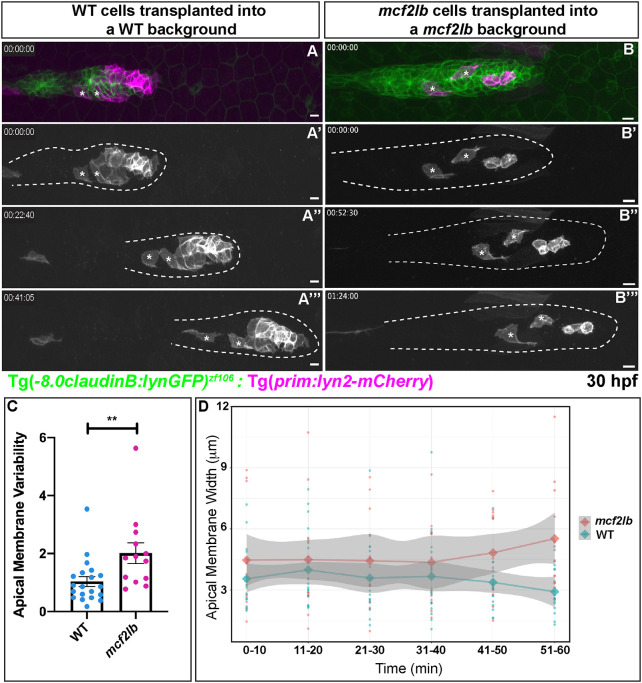
mcf2lb mutants show greater variability in apical membrane dynamics. (A-B‴) Donor cells derived from either WT or mcf2lb mutant Tg(prim:lyn2-mCherry) (magenta) were transplanted into WT or mcf2lb mutant Tg(-8.0claudinB: lynGFP)zf106-positive (green) embryos, respectively, and mounted for live imaging between 30 and 32 hpf (Movie 5,6). Tg(prim:lyn2-mCherry) cells are shown in grayscale for clarity. Asterisks indicate cells used for analysis. (C) Mean membrane variability of transplanted WT (n=22 cells from seven embryos) or mcf2lb mutant (n=13 cells from three embryos) cells over time from movies obtained from experiments in panels A and B. Membrane variability is defined as the standard deviation of the apical width of a cell over an hour period of imaging in apically constricted cells. Error bar is s.d. (D) Apical membrane width over time with s.e.m. (shaded area). Note higher variability in the mutant. **P<0.01 (Mann–Whitney U-test). Scale bars: 10 μm.

Acknowledgments
This image is the copyrighted work of the attributed author or publisher, and ZFIN has permission only to display this image to its users. Additional permissions should be obtained from the applicable author or publisher of the image. Full text @ Development