
- Title
-
Functional and pharmacological analyses of visual habituation learning in larval zebrafish
- Authors
- Lamiré, L.A., Haesemeyer, M., Engert, F., Granato, M., Randlett, O.
- Source
- Full text @ Elife

Volumetric two-photon Ca2+ imaging of dark flash (DF) habituation. (A) In response to a DF, larval zebrafish execute a high-amplitude turn called an O-bend response. (B) Habituation results in a progressive decrease in response probability to DFs repeated at 1 min intervals, delivered in four blocks of 60 stimuli, separated by 1 hr of rest (from 0:00 to 7:00), and after a 5 hr retention period (12:00-). Inset (i) shows an expanded view of the first training block. (C) Tg(elavl3:H2B-GCaMP7f) larvae were imaged across 12 z-planes at 10 µm steps. Regions of Interest (ROIs) are overlaid in random colours. (D) Density of detected ROIs registered and plotted in the Z-Brain coordinate space. n = 1,050,273 ROIs across 34 larvae. (E) Cropped field of view used for plotting and analysing Ca2+ imaging data and approximate anatomical localizations of major brain areas: dien, diencephalon; mid-b, midbrain; cb, cerebellum; hind-b, hindbrain; io, inferior olive; ret, retina; tec, tectum. (F) Functional responses of neurons to 60 DFs at 1 min intervals, plotted as a clustered heatmap (‘rastermap’; Pachitariu et al., 2017, https://github.com/MouseLand/rastermap, copy archived at MouseLand, 2023) where rows represent individual neurons ordered by the similarities in their activity. Darker shades reflect increased activity. This clustering reveals neurons that are tuned to the DF stimuli (pink box) or motor events (green box). Dashed trace above the heatmap depicts the DF stimulus convolved with a kernel approximating H2B-GCaMP7f kinetics. (G) ROIs in an individual fish plotted based on their correlation and tuning to regressors defining either motor or DF stimulus events, highlighting the spatial distributions of these tunings across the imaged population. Plotted as a maximum intensity projection. (H) Same analysis as (G), but across the entire population of 34 larvae. (I) ROIs in an individual fish plotted based on their correlation and tuning to regressors defining either the first or last three DF stimuli. (J) Same analysis as (I), but across the entire population of 34 larvae. tl, torus longitudinalis. |
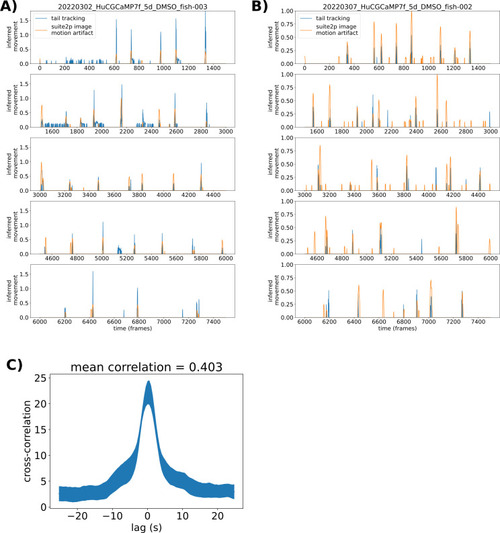
Validation of motion analysis based on image artefacts during two-photon imaging. (A) Motion indexes as calculated based on tail tracking (blue) and based on decreases in the correlation between individual frames and the reference frame used for motion alignment (orange) across the entire imaging experiment (65 min). (B) Same analysis as (A), for a different larva. (C) Cross-correlation plot comparing the two motion index vectors. Mean across six larvae, and line thickness = standard error. |

Characterization of functional response types during habituation learning. ( |

Pharmacological screening for dark flash habituation modulators. (A) Screening setup to record larval zebrafish behaviour in 300-well plates, which are placed below a 31°C water bath that acts as a heated lid for the behaviour plates. Two 300-well plates are imaged in alternation using mirrors mounted on stepper motors. Fish are illuminated with infrared LEDs and imaged with a high-speed camera recording at 560 frames per second (fps). Visual stimuli are delivered by a rectangular ring of RGB LEDs, and acoustic stimuli are delivered via a solenoid mounted on the back of the water tank. Colours overlaid on the 300-well plate indicate the arrangement of small-molecule treatments and controls (yellow). (B) Habituation results in a progressive decrease in responsiveness to dark flashes repeated at 1 mi intervals, delivered in four training blocks of 60 stimuli, separated by 1 hr of rest (from 0:00 to 7:00). This epoch is separated into periods reflective of the naive response (first five stimuli, blue), and the remaining 235 stimuli during training (green). From 8:00 to 8:30, no stimuli are delivered and fish are monitored for spontaneous behaviour (yellow). From 8:30 to 9:00, fish are given acoustic stimuli via the solenoid tapping on the water bath (pink). From 10:00 to 11:00, fish are stimulated with alternating leftward and rightward motion using the RGB LEDs to induce the optomotor response and turning towards the direction of motion (light blue). Finally, at 12:00–13:00, larvae are given 60 additional dark flashes during the test period (red). Same data as Figure 1B. (C) The strictly standardized mean difference (SSMD) is calculated across these different time periods, behaviours, and the different components of O-Bend behavioural habituation (Randlett et al., 2019). All compounds were dosed at 10 µM in 0.1% DMSO (n = 6 larvae), relative to 0.1% DMSO vehicle controls (n = 60 larvae). (D) These vectors are assembled across all screened compounds that were viable and did not cause death or paralysis of the larvae. Displayed as a hierarchically clustered heatmap of behavioural fingerprints (vectors of SSMD values). Clustering distance = ward, standardized Euclidean. |

Pharmaco-behavioural analyses of behaviour-modifying compounds. ( |

Confirmed pharmacological modulators of habituation. Dose–response studies for (A) picrotoxinin, (B) melatonin, (C) ethinyl estradiol, and (D) hexestrol. Displayed for each treatment are (i) behavioural fingerprint for the original screen data (10 uM) and the dose–response data. (ii) Original screen data for the probability of response to dark flash (DF) stimuli. Each dot is the probability of response to one flash. Lines are smoothed in time with a Savitzky–Golay filter (window = 15 stimuli, order = 2). (iii) Dose–response data for the probability of response, plotted as in (ii). |
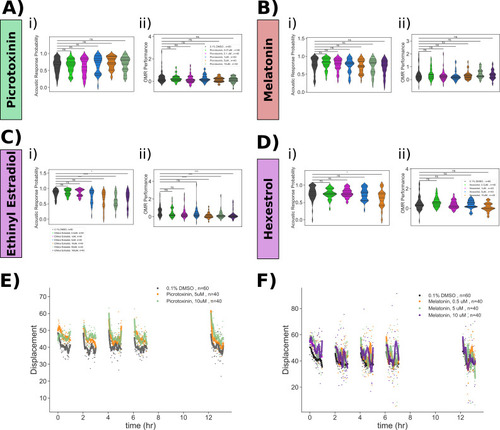
Pharmacological manipulation of control behaviours and response displacement during habituation. Dose–response studies for ( |

Picrotoxinin and melatonin alter the proportions of functionally identified neurons. (A) Percent habituation for larvae during Ca2+ imaging, calculated as %Habituation=100×(1−P(Resp31→60)0.5×(P(Resp1→30)+P(Resp31→60))) (B) Heatmap of response profiles of ROIs categorized into the 12 functional clusters from larvae treated with DMSO (vehicle control, n = 428,720 total ROIs in 14 larvae), Picrotoxinin (PTX, 10 uM, n = 271,037 total ROIs in 9 larvae), or melatonin (1 uM, n = 350,516 total ROIs in 11 larvae). (C) Proportion of neurons belonging to each functional cluster across treatment groups. Distributions for violin plots are bootstrapped from 5000 replicates. (D) Same data as (C), only showing the data for PTX vs DMSO vehicle control, reordered to reflect the cluster Adaptation Profiles grouped by cluster Response Shape. |
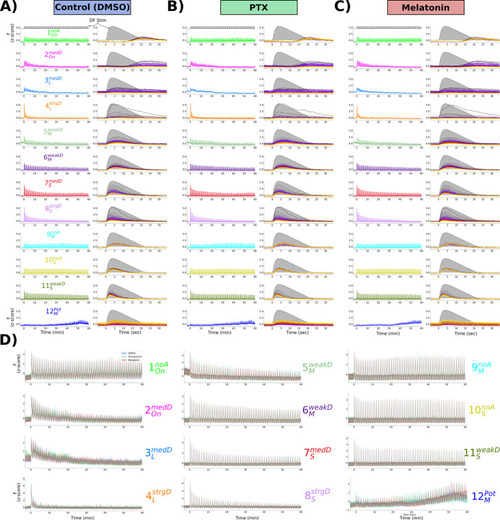
Mean response of functionally identified clusters after different pharmacological treatments. ( |

Identification of GABAergic neuronal classes. ( |