
|
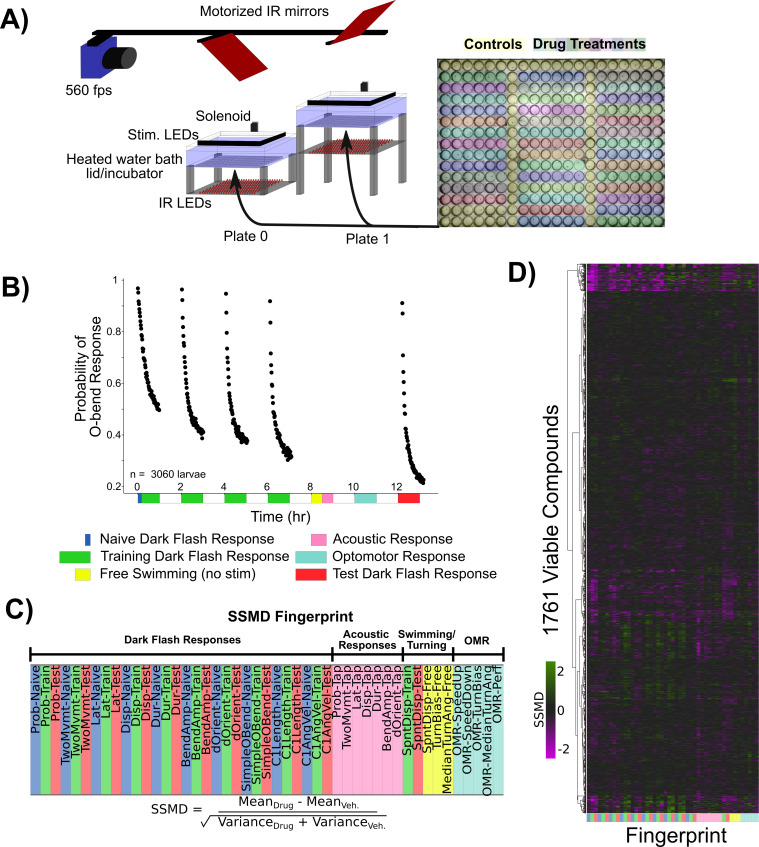
Figure 3 Pharmacological screening for dark flash habituation modulators. (A) Screening setup to record larval zebrafish behaviour in 300-well plates, which are placed below a 31°C water bath that acts as a heated lid for the behaviour plates. Two 300-well plates are imaged in alternation using mirrors mounted on stepper motors. Fish are illuminated with infrared LEDs and imaged with a high-speed camera recording at 560 frames per second (fps). Visual stimuli are delivered by a rectangular ring of RGB LEDs, and acoustic stimuli are delivered via a solenoid mounted on the back of the water tank. Colours overlaid on the 300-well plate indicate the arrangement of small-molecule treatments and controls (yellow). (B) Habituation results in a progressive decrease in responsiveness to dark flashes repeated at 1 mi intervals, delivered in four training blocks of 60 stimuli, separated by 1 hr of rest (from 0:00 to 7:00). This epoch is separated into periods reflective of the naive response (first five stimuli, blue), and the remaining 235 stimuli during training (green). From 8:00 to 8:30, no stimuli are delivered and fish are monitored for spontaneous behaviour (yellow). From 8:30 to 9:00, fish are given acoustic stimuli via the solenoid tapping on the water bath (pink). From 10:00 to 11:00, fish are stimulated with alternating leftward and rightward motion using the RGB LEDs to induce the optomotor response and turning towards the direction of motion (light blue). Finally, at 12:00–13:00, larvae are given 60 additional dark flashes during the test period (red). Same data as Figure 1B. (C) The strictly standardized mean difference (SSMD) is calculated across these different time periods, behaviours, and the different components of O-Bend behavioural habituation (Randlett et al., 2019). All compounds were dosed at 10 µM in 0.1% DMSO (n = 6 larvae), relative to 0.1% DMSO vehicle controls (n = 60 larvae). (D) These vectors are assembled across all screened compounds that were viable and did not cause death or paralysis of the larvae. Displayed as a hierarchically clustered heatmap of behavioural fingerprints (vectors of SSMD values). Clustering distance = ward, standardized Euclidean.