Image
Figure Caption

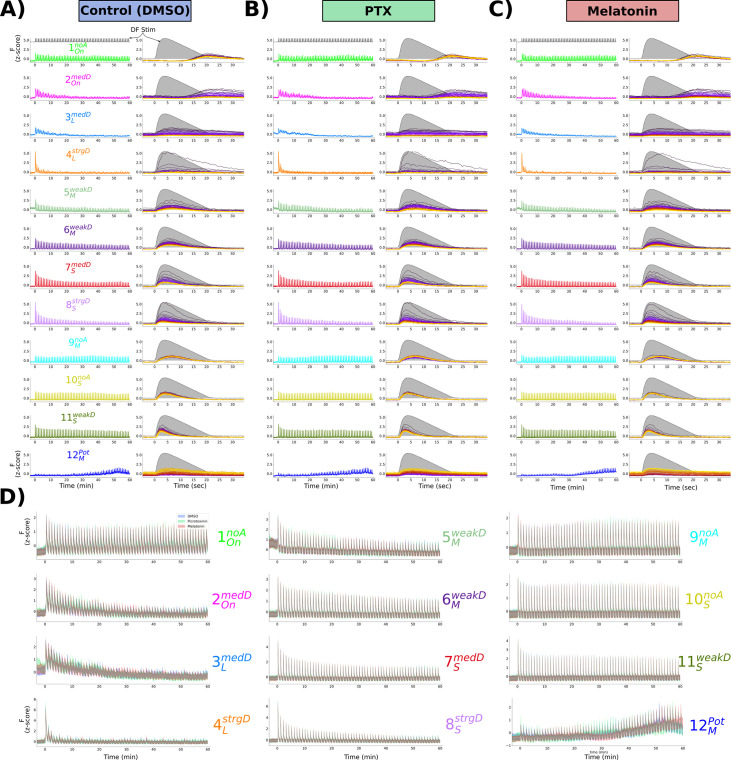
Figure 6—figure supplement 1. Mean response of functionally identified clusters after different pharmacological treatments.

(A–C) Average z-scored fluorescence each functional cluster plotted for the whole experiment (left column) and centred on each dark flash (DF) stimulus (right column), demonstrating the differences in both adaptation and Response Shape for each cluster after treatment with (A) 0.1% DMSO vehicle control, (B) picrotoxinin (10 uM), or (C) melatonin (1 uM). (D) Same data as (AC), plotted together for each treatment group.

Acknowledgments
This image is the copyrighted work of the attributed author or publisher, and ZFIN has permission only to display this image to its users. Additional permissions should be obtained from the applicable author or publisher of the image. Full text @ Elife