
- Title
-
Differential expression of mechanotransduction complex genes in auditory/vestibular hair cells in zebrafish
- Authors
- Smith, E.T., Sun, P., Yu, S.K., Raible, D.W., Nicolson, T.
- Source
- Full text @ Front. Mol. Neurosci.
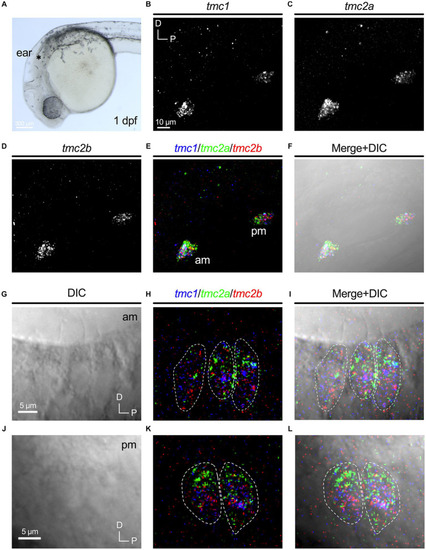
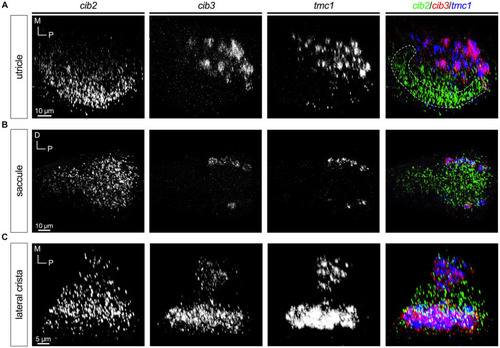
Overlapping expression of |
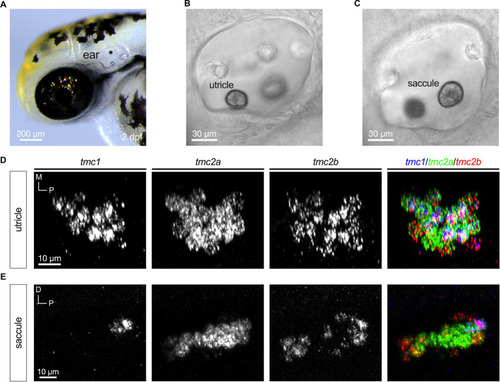
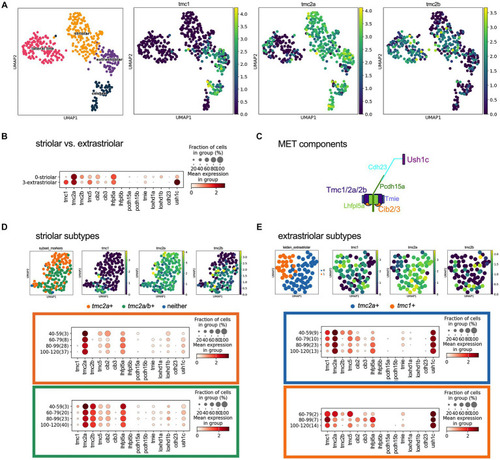
Emergence of differential expression of |
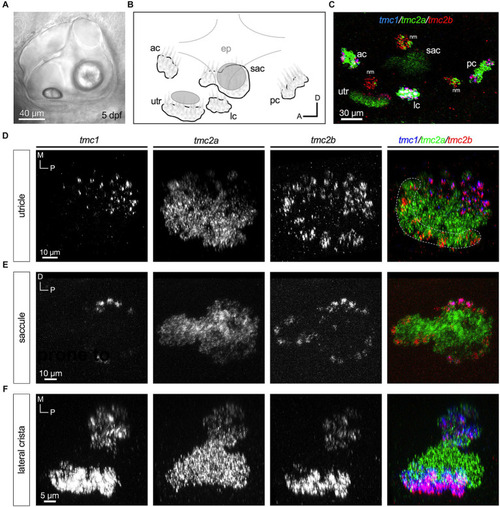
Central zones of |

Differential expression in hair cell layers of the lateral crista at 5 dpf. |
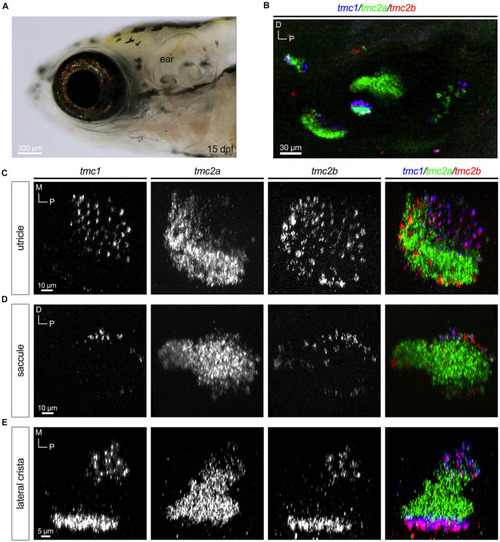
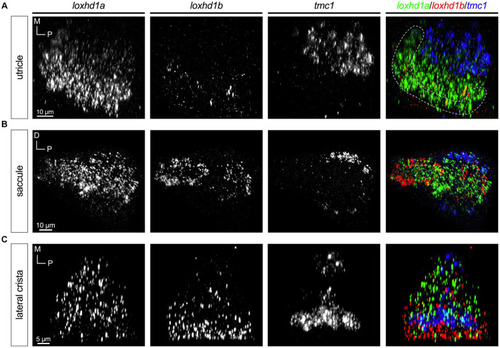
Differential pattern of expression of |
Expression of |
Expression of |
|
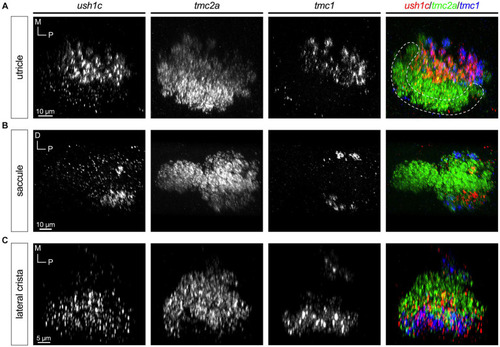
Expression of |