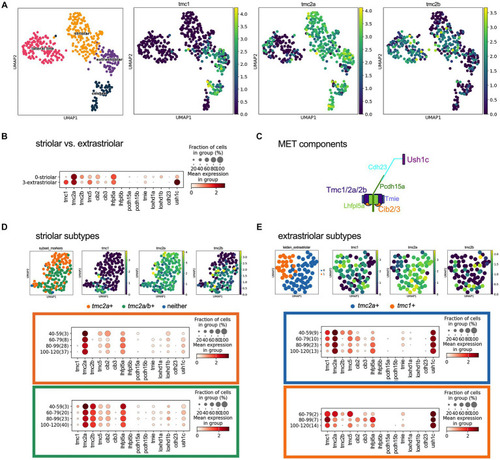
Expression of tmc1/2a/2b and mechanotransduction components in hair cells at 40–120 hpf using scRNAseq data. (A) UMAP distributing the striolar, extrastriolar, lateral line and ampullary/cristae inner ear hair cells with expression of tmc1/2a/2b with log-normalized scRNAseq expression output. (B) Dotplot comparing presence and expression of these components in striolar vs. extrastriolar hair cells of the macular organs. (C) Diagram of the components that comprise the mechanotransduction complex. (D) UMAP of the striolar subset and clustered to tmc2a + versus tmc2a/2b + with dotplot showing the expression distribution of MET channel components for the tmc2a + (orange) compared to tmc2a/2b + (green). (E) UMAP of the extrastriolar subset and clustered to tmc2a + versus tmc1+ with dotplot showing the expression distribution of mechanotransduction channel components for the tmc2a + (blue) compared to tmc1+ (orange). In the Y-axis of the dotplot, the age of the cell is grouped in hours with the number of samples in the group labeled in parenthesis.
|
