IMAGE

Figure 5

ID
ZDB-IMAGE-231201-32
Source
Figures for Smith et al., 2023
Image
Figure Caption

Figure 5

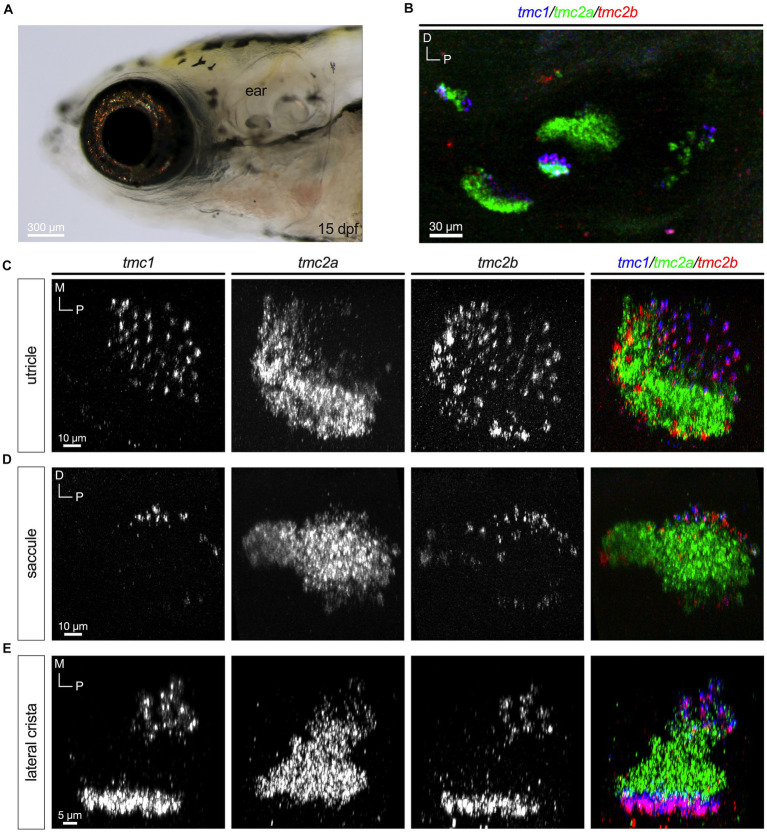
Differential pattern of expression of tmc1/2a/2b persists at 15 dpf. (A) Lateral view of the inner ear. (B) Overview of tmc1/2a/2b expression in the ear. (C–E) Single-channel fluorescence for each gene is shown along with merged images (right panels). In merged images, fluorescent label for tmc1 transcripts is shown in blue, tmc2a in green, and tmc2b in red.

Acknowledgments
This image is the copyrighted work of the attributed author or publisher, and ZFIN has permission only to display this image to its users. Additional permissions should be obtained from the applicable author or publisher of the image. Full text @ Front. Mol. Neurosci.