
- Title
-
Dynamic Regulation of brsk2 in the Social and Motor Development of Zebrafish: A Developmental Behavior Analysis
- Authors
- Deng, J., Liu, C., Hu, M., Hu, C., Lin, J., Li, Q., Xu, X.
- Source
- Full text @ Int. J. Mol. Sci.
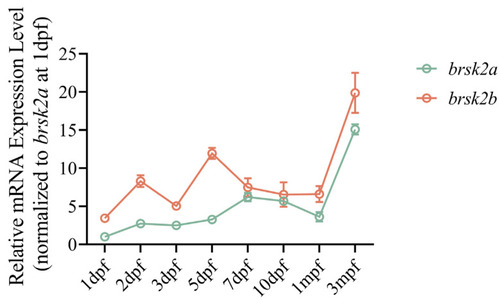
Temporal pattern of mRNA expression of zebrafish |
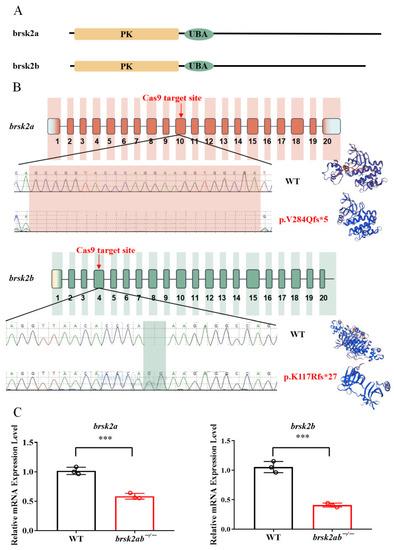
Generation of |
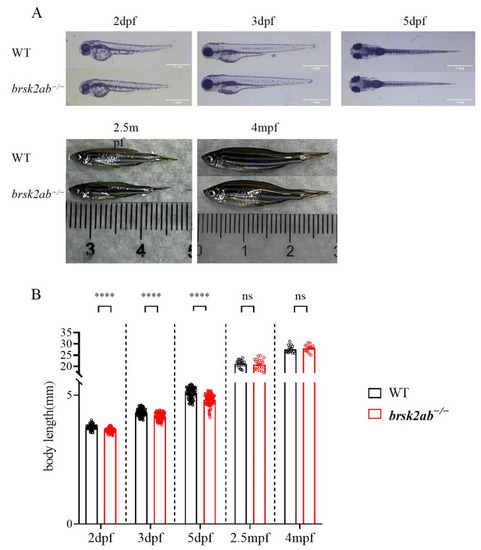
|
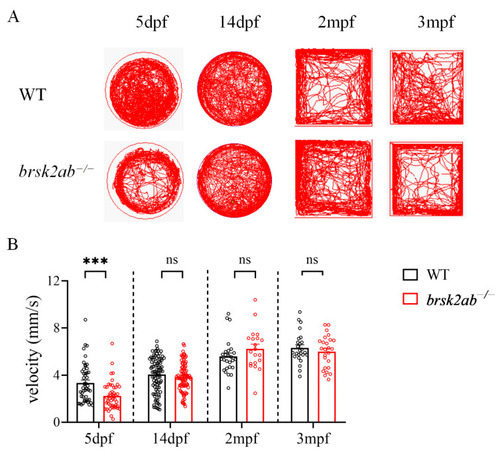
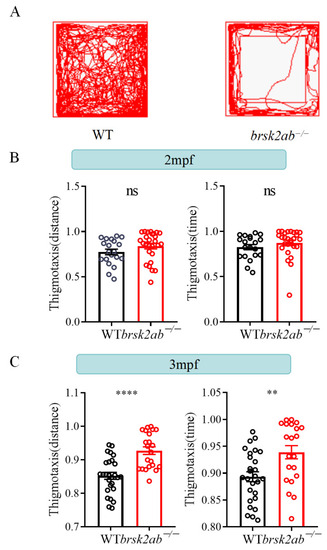
The locomotor activity of |
PHENOTYPE:
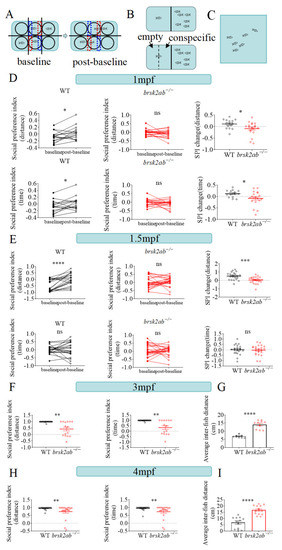
|
PHENOTYPE:
|