
- Title
-
In toto imaging of glial JNK signaling during larval zebrafish spinal cord regeneration
- Authors
- Becker, C.J., Cigliola, V., Gillotay, P., Rich, A., De Simone, A., Han, Y., Di Talia, S., Poss, K.D.
- Source
- Full text @ Development
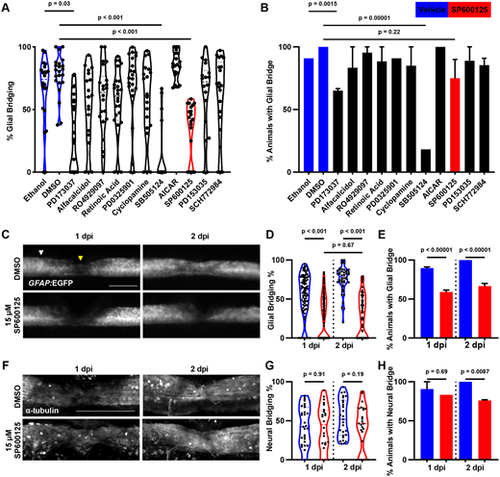
A shelf screen identifies JNK signaling as necessary for glial bridging. (A) A shelf screen of 11 compounds identifies Fgf, Tgfβ and JNK as important signaling pathways for glial bridging in embryonic spinal cord regeneration. Control treatments are shown in blue and SP600125 treatment is shown in red for emphasis for panels A, B, D, E, G and H. The percentage of glial bridging is measured by dividing the width of the GFAP+ tissue bridge at 2 dpi by the width of the uninjured spinal cord anterior to the lesion site (n=20-25 in two experiments; Kruskal–Wallis with Dunn's multiple comparisons test). (B) Inhibition of Fgf, Tgfβ or JNK signaling results in fewer fish able to form GFAP+ tissue bridges, defined as at least one process visually spanning the lesion site. n=20-25 in two experiments; Fischer's exact test. Five out of 20 animals did not form a bridge after JNK inhibition, compared with none of the 22 DMSO-treated controls. (C) GFAP+ glial bridges during spinal cord regeneration in DMSO-treated and SP600125-treated animals. Glial bridging percentage was calculated by taking the ratio of the width of the thinnest point of the glial bridge (yellow arrowhead) to the full width of the uninjured cord directly anterior to the lesion (white arrowhead). Scale bar: 100 µm. (D) JNK inhibition reduces the thickness of GFAP+ glial bridges at both 1 and 2 dpi. Glial bridges in SP600125-treated animals did not significantly change in width from 1 to 2 dpi (n=100 over three repeated experiments; two-tailed Mann–Whitney test). (E) JNK inhibition results in fewer fish forming GFAP+ tissue bridges at 1 and 2 dpi (n=100 over three repeated experiments; Fischer's exact test). At 1 dpi, 55 of 144 animals did not form a bridge after JNK inhibition at, compared with nine out of 100 in DMSO-treated controls. At 2 dpi, 33 of 110 did not form a bridge after JNK inhibition compared with none of the 100 DMSO-treated controls. (F) Neural bridging labeled by whole-mount immunofluorescence for acetylated α-tubulin. Scale bar: 100 µm. (G) JNK inhibition does not measurably affect the thickness of neural bridges at 1 and 2 dpi (n=20-30 in two experiments; two-tailed Mann–Whitney test). (H) JNK inhibition results in slightly fewer fish able to form neural bridges at 2 dpi (n=20-30 in two experiments; Fischer's exact test). |
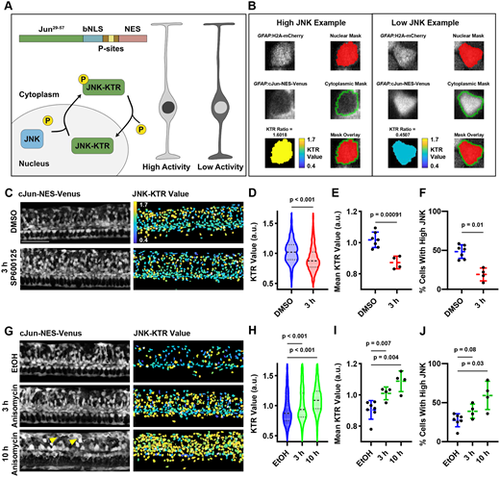
A kinase translocation reporter measures JNK activity in GFAP+ cells. (A) Schematic of JNK-KTR, which measures JNK activity by its accumulation in the nucleus or cytoplasm depending on phosphorylation state. When JNK activity is high, the reporter will be shuttled to the cytoplasm, and when JNK activity is low, the reporter will accumulate in the nucleus. Examples are depicted in grayscale on the right where the lighter color represents brighter fluorescence. (B) Examples of high and low JNK activity in individual GFAP+ cells in the larval zebrafish spinal cord. Left: A cell with high JNK activity. Right: A cell with low JNK activity. Top: H2A-mCherry channel for a single cell and the nuclear mask generated by TGMM. Middle: cJun-NES-Venus channel for a single cell and the cytoplasmic mask, generated by a dilation and subsequent subtraction of the original nuclear mask. Average Venus fluorescence in the cytoplasmic compartment is divided by average Venus fluorescence in the nucleus of each cell to calculate the KTR value for each cell, shown as a heat map on bottom left. Both masks are shown over the H2A-mCherry channel on bottom right. (C) SP600125 treatment for 3 h causes nuclear translocation of cJun-NES-Venus. Images shown are from the same individual fish over the course of treatment. Left: Maximum intensity projection of cJun-NES-Venus fluorescence. Right: Heatmap of calculated JNK-KTR values in each individual cell. Scale bar: 100 µm. (D) SP600125 treatment for 3 h shifts the distribution of JNK activity down within an individual animal. Violin plots shown are the distribution of individual measurements for each cell within the same animal over the course of SP6001215 treatment (n=500 individual cell measurements within an individual animal for each condition; two-tailed Mann–Whitney test). (E) SP600125 treatment for 3 h decreases the mean JNK-KTR value among all cells in the 72 hpf spinal cord (n=4-7 animals over two experiments; two-tailed t-test with Welch's correction). (F) SP600125 treatment for 3 h decreases the proportion of cells with high JNK activity in the 72 dpf spinal cord (n=4-7 animals over two experiments; two-tailed t-test with Welch's correction). (G) Anisomycin treatment for 10 h causes cytoplasmic translocation of cJun-NES-Venus. Images shown are from the same individual fish over the course of treatment. Left: Maximum intensity projection of cJun-NES-Venus fluorescence (note nuclear ‘shadows’ in several dorsally located cells marked with yellow arrowheads). Right: Heatmap of calculated JNK-KTR values in each individual cell. (H) Anisomycin treatments for 3 and 10 h shift the distribution of JNK activity up within an individual animal (n=500 individual cell measurements within an individual animal for each condition; two-tailed Mann–Whitney). (I) Anisomycin treatments for 3 and 10 h increase the mean JNK-KTR value among all cells in the 96 hpf spinal cord (n=4-7 animals over two experiments; two-tailed t-test with Welch's correction). (J) Anisomycin treatments for 3 and 10 h increase the proportion of cells with high JNK activity in the 96 hpf spinal cord (n=4-7 animals over two experiments; two-tailed t-test with Welch's correction). a.u., arbitrary units; EtOH, ethanol. |
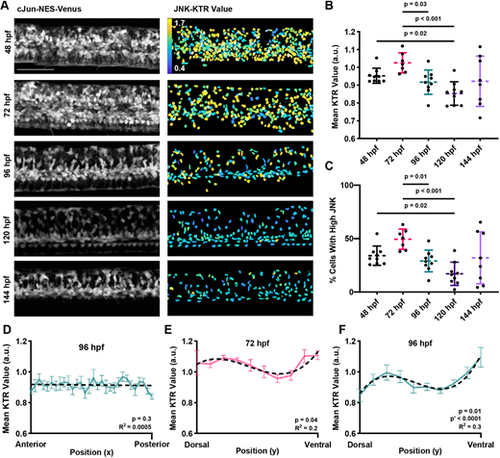
JNK signaling dynamics during spinal cord development. (A) Cellular localization changes of cJun-NES-Venus fluorescence during development. Images shown are from the same individual fish over time. Left: Maximum intensity projection of cJun-NES-Venus fluorescence. Right: Heatmap of calculated JNK-KTR values in each individual cell. Scale bar: 100 µm. (B) JNK-KTR indicates high mean JNK activity among all cells at 48 and 72 hpf in the larval spinal cord and lower mean activity at 96-144 hpf (n=7-9 animals across three experiments; Welch's ANOVA with Dunnett's T3 multiple comparison test). (C) The proportion of cells with high JNK activity follows the same trend as mean JNK activity, with more cells with high JNK at 48 and 72 hpf than at 96-144 hpf (n=7-9 animals across three experiments; Welch's ANOVA with Dunnett's T3 multiple comparison test). (D) JNK activity shows no bias on the anteroposterior axis of the developing spinal cord at 96 hpf. The dashed black line represents a linear line of fit (R2 shown bottom right). Colored line represents the mean JNK activity in each bin (n=9 animals across three experiments; error bars represent s.e.m.; one-way Welch's ANOVA). (E,F) JNK activity shows a dorsal bias in JNK activity at 72 and 96 hpf. In addition to the peak of JNK activity at the dorsal side of the tissue, a local maximum can be identified more ventrally, potentially indicating multiple foci of JNK activity within the developing spinal cord. Dashed black line represents a cuboidal line of fit (R2 shown bottom right). Colored line represents the mean JNK activity in each bin (n=7-9 animals across three experiments; error bars represent s.e.m.; one-way Welch's ANOVA). a.u. arbitrary units. |
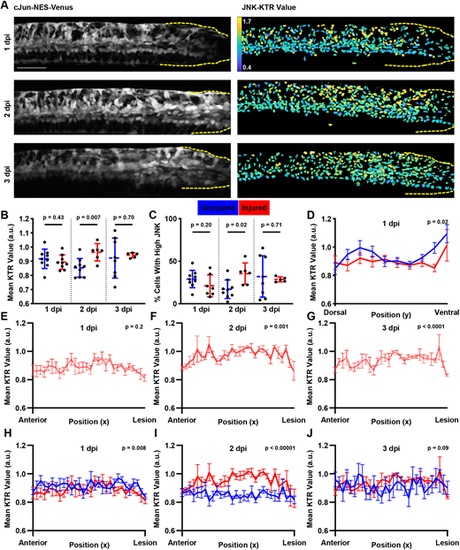
JNK signaling increases after SCI. (A) Cellular localization changes of cJun-NES-Venus fluorescence after SCI. Images shown are from the same individual fish over time. Left: Maximum intensity projection of cJun-NES-Venus fluorescence. Right: Heatmap of calculated JNK-KTR values in each individual cell. Dashed yellow lines show the location of the lesion site. Scale bar: 100 µm. (B) JNK-KTR indicates higher mean JNK activity among all cells at 2 dpi compared with age-matched uninjured controls, but not at 1 or 3 dpi (n=6 animals across two experiments; two-tailed t-test with Welch's correction). (C) The proportion of cells with high JNK activity increases at 2 dpi compared with age-matched uninjured controls, but not 1 or 3 dpi (n=6 animals across two experiments; two-tailed t-test with Welch's correction). (D) JNK-KTR at 1 dpi shows a diminished dorsal bias and no ventral local maximum compared with age-matched controls. Each line represents the mean JNK activity in each bin (n=6-9 animals across two experiments; error bars represent s.e.m.; two-way ANOVA comparing both curves). (E) JNK-KTR values at 1 dpi do not change along the AP axis. The red line represents the mean JNK activity in each bin (n=6 animals across three experiments; error bars represent s.e.m.; one-way Welch's ANOVA). (F,G) JNK-KTR values at 2 and 3 dpi change along the AP axis. The red line represents the mean JNK activity in each bin (n=6 animals across three experiments; error bars represent s.e.m.; one-way Welch's ANOVA). (H) JNK-KTR at 1 dpi shows similar AP patterning to age-matched controls. Although we do not detect a change in JNK activity over the AP axis, JNK levels are slightly lower across the tissue compared with age-matched controls. Each line represents the mean JNK activity in each bin (n=6-9 animals across two experiments; error bars represent s.e.m.; two-way ANOVA comparing both curves). (I) JNK-KTR at 2 dpi shows a posterior bias in JNK signaling compared with age-matched controls. Each line represents the mean JNK activity in each bin (n=6-9 animals across two experiments; error bars represent s.e.m.; two-way ANOVA comparing both curves). In injured animals, JNK signaling increases towards the lesion site before dropping sharply at the lesion itself. JNK levels are higher across the tissue in injured animals. (J) JNK-KTR at 3 dpi shows a slight posterior bias in JNK signaling compared with age-matched controls, but overall JNK levels in the tissue are not significantly changed. Each line represents the mean JNK activity in each bin (n=5-7 animals across two experiments; error bars represent s.e.m.; two-way ANOVA comparing both curves). a.u. arbitrary units. |
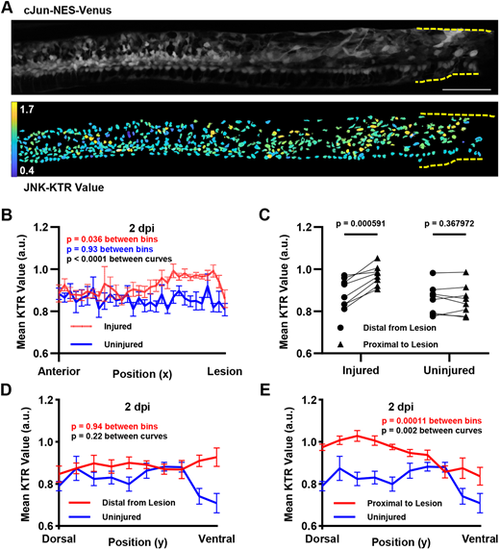
Spatial patterning of JNK activity after SCI. (A) JNK activity along the full anterior expanse of the spinal cord at 2 dpi. Top: Maximum intensity projection of cJun-NES-Venus fluorescence. Bottom: Heatmap of calculated JNK-KTR values in each individual cell. Dashed yellow lines show the location of the lesion site. Scale bar: 100 µm. (B) JNK-KTR values at 2 dpi increase near the lesion site and are comparable to JNK values in an uninjured control animal distal to the lesion site. Each line represents the mean JNK activity in each bin along the x-axis (n=8 animals across two experiments; error bars represent s.e.m.; two-way ANOVA in black comparing both curves, and one-way ANOVA in red and blue for the comparison between bins of the 2 dpi and uninjured datasets, respectively). (C) Each individual animal measured at 2 dpi reveals significantly higher JNK activity proximal to the lesion than distal to the lesion, as demonstrated by average JNK activity in two discrete bins. Uninjured animals show no significant trend in JNK activity across the same image frame (n=8 animals across two experiments; paired t-test). (D) JNK activity distal from the lesion shows no bias in DV distribution, and no measurable change in DV distribution from uninjured controls. Each line represents the mean JNK activity in each bin along the y-axis, and the red line represents values measured in cells in the distal half of each image from the injury site (n=8 animals across two experiments; two-way ANOVA in black comparing both curves, and one-way ANOVA in red for the comparison between bins in the injured dataset). (E) JNK activity proximal to the lesion shows a dorsal bias in DV distribution, which differs significantly from the DV distribution in uninjured controls. Each line represents the mean JNK activity in each bin along the y-axis, and the red line represents values measured in cells in the proximal half of each image to the injury site (n=8 animals across two experiments; two-way ANOVA in black comparing both curves, and one-way ANOVA in red for the comparison between bins in the injured dataset). a.u. arbitrary units. |
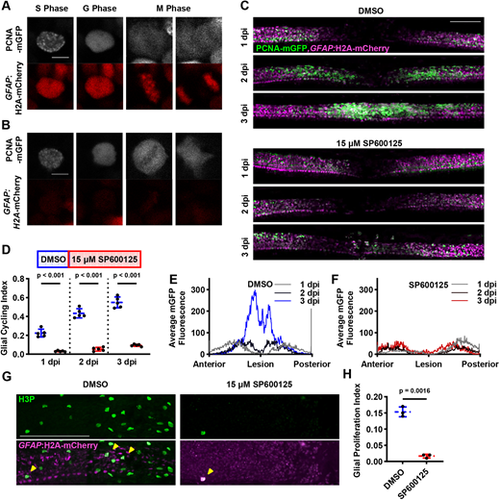
JNK activity is required for GFAP+ cell cycling during larval spinal cord regeneration. (A) PCNA-mGFP distribution is predictive of mitosis in GFAP+ cells. Cells exhibit characteristic patterns, which allows us to identify S phase (speckling), G phase and M phase in live animals over time. Scale bar: 5 µm. (B) PCNA-mGFP distribution is also predictive of mitosis in GFAP− cells. Scale bar: 5 µm. (C) PCNA-mGFP pattern in vehicle- and JNK inhibitor-treated animals during spinal cord regeneration. Maximum intensity projections are shown with a GFAP:H2A-mCherry-derived mask applied to the EGFP channel to filter out GFAP− PCNA+ cells. The same animal is shown for each condition at different time points during regeneration. Scale bar: 100 µm. (D) JNK inhibition results in demonstrably lower glial cell cycling at 1-3 dpi during spinal cord regeneration (n=6 animals across two experiments; two-tailed t-test with Welch's correction). (E) PCNA-mGFP localization during regeneration in glia of DMSO-treated animals. At 1 dpi, PCNA-mGFP is expressed on either side of the lesion site. By 3 dpi there is a large increase in PCNA-mGFP signal in the lesion site itself. Each line represents the average PCNA-mGFP fluorescence values thresholded by GFAP:H2A-mCherry and binned along the AP axis for each indicated time point (n=6 animals across two experiments). (F) PCNA-mGFP localization during regeneration in glia of SP600125-treated animals. At 1 dpi, there is a modest peak of PCNA-mGFP fluorescence to the posterior side of the lesion, but broadly lower expression than in DMSO-treated controls. This localization is similar at later time points, even after SP600125 treatment has ceased. Each line represents the average of PCNA-mGFP fluorescence values thresholded by GFAP:H2A-mCherry and binned along the AP axis for each indicated time point (n=6 animals across two experiments). (G) Mitotic glia marked by immunofluorescence for H3P and GFAP:H2A-mCherry native fluorescence after SPI. Maximum intensity projections are shown, including GFAP− tissue around the spinal cord, which also contains H3P+ cells. Yellow arrowheads indicate GFAP+H3P+ cells. Scale bar: 100 µm. (H) Measurably fewer GFAP+/H3P+ cells are present in injured spinal cords after SP600125 treatment (n=6 animals across two experiments; two-tailed t-test with Welch's correction). |