
|
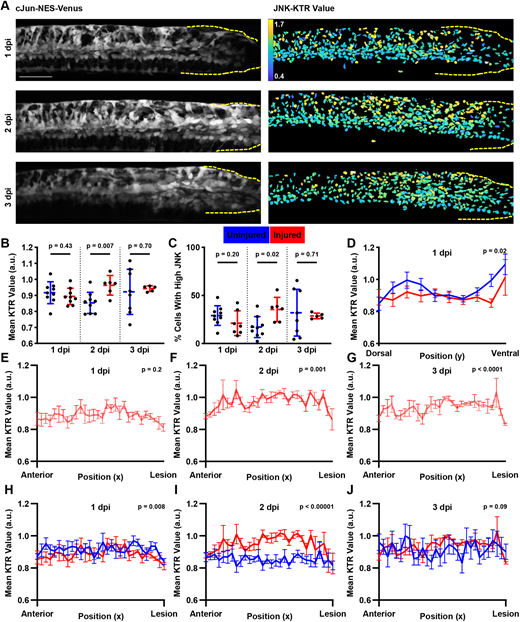
Fig. 4 JNK signaling increases after SCI. (A) Cellular localization changes of cJun-NES-Venus fluorescence after SCI. Images shown are from the same individual fish over time. Left: Maximum intensity projection of cJun-NES-Venus fluorescence. Right: Heatmap of calculated JNK-KTR values in each individual cell. Dashed yellow lines show the location of the lesion site. Scale bar: 100 µm. (B) JNK-KTR indicates higher mean JNK activity among all cells at 2 dpi compared with age-matched uninjured controls, but not at 1 or 3 dpi (n=6 animals across two experiments; two-tailed t-test with Welch's correction). (C) The proportion of cells with high JNK activity increases at 2 dpi compared with age-matched uninjured controls, but not 1 or 3 dpi (n=6 animals across two experiments; two-tailed t-test with Welch's correction). (D) JNK-KTR at 1 dpi shows a diminished dorsal bias and no ventral local maximum compared with age-matched controls. Each line represents the mean JNK activity in each bin (n=6-9 animals across two experiments; error bars represent s.e.m.; two-way ANOVA comparing both curves). (E) JNK-KTR values at 1 dpi do not change along the AP axis. The red line represents the mean JNK activity in each bin (n=6 animals across three experiments; error bars represent s.e.m.; one-way Welch's ANOVA). (F,G) JNK-KTR values at 2 and 3 dpi change along the AP axis. The red line represents the mean JNK activity in each bin (n=6 animals across three experiments; error bars represent s.e.m.; one-way Welch's ANOVA). (H) JNK-KTR at 1 dpi shows similar AP patterning to age-matched controls. Although we do not detect a change in JNK activity over the AP axis, JNK levels are slightly lower across the tissue compared with age-matched controls. Each line represents the mean JNK activity in each bin (n=6-9 animals across two experiments; error bars represent s.e.m.; two-way ANOVA comparing both curves). (I) JNK-KTR at 2 dpi shows a posterior bias in JNK signaling compared with age-matched controls. Each line represents the mean JNK activity in each bin (n=6-9 animals across two experiments; error bars represent s.e.m.; two-way ANOVA comparing both curves). In injured animals, JNK signaling increases towards the lesion site before dropping sharply at the lesion itself. JNK levels are higher across the tissue in injured animals. (J) JNK-KTR at 3 dpi shows a slight posterior bias in JNK signaling compared with age-matched controls, but overall JNK levels in the tissue are not significantly changed. Each line represents the mean JNK activity in each bin (n=5-7 animals across two experiments; error bars represent s.e.m.; two-way ANOVA comparing both curves). a.u. arbitrary units.