
Fig. 2
- ID
- ZDB-FIG-240301-21
- Publication
- Becker et al., 2023 - In toto imaging of glial JNK signaling during larval zebrafish spinal cord regeneration
- Other Figures
- All Figure Page
- Back to All Figure Page
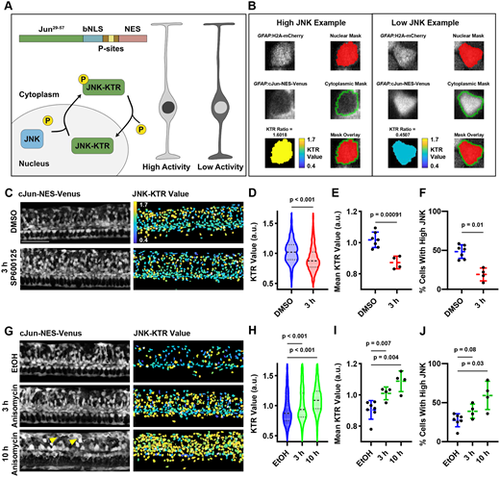
A kinase translocation reporter measures JNK activity in GFAP+ cells. (A) Schematic of JNK-KTR, which measures JNK activity by its accumulation in the nucleus or cytoplasm depending on phosphorylation state. When JNK activity is high, the reporter will be shuttled to the cytoplasm, and when JNK activity is low, the reporter will accumulate in the nucleus. Examples are depicted in grayscale on the right where the lighter color represents brighter fluorescence. (B) Examples of high and low JNK activity in individual GFAP+ cells in the larval zebrafish spinal cord. Left: A cell with high JNK activity. Right: A cell with low JNK activity. Top: H2A-mCherry channel for a single cell and the nuclear mask generated by TGMM. Middle: cJun-NES-Venus channel for a single cell and the cytoplasmic mask, generated by a dilation and subsequent subtraction of the original nuclear mask. Average Venus fluorescence in the cytoplasmic compartment is divided by average Venus fluorescence in the nucleus of each cell to calculate the KTR value for each cell, shown as a heat map on bottom left. Both masks are shown over the H2A-mCherry channel on bottom right. (C) SP600125 treatment for 3 h causes nuclear translocation of cJun-NES-Venus. Images shown are from the same individual fish over the course of treatment. Left: Maximum intensity projection of cJun-NES-Venus fluorescence. Right: Heatmap of calculated JNK-KTR values in each individual cell. Scale bar: 100 µm. (D) SP600125 treatment for 3 h shifts the distribution of JNK activity down within an individual animal. Violin plots shown are the distribution of individual measurements for each cell within the same animal over the course of SP6001215 treatment (n=500 individual cell measurements within an individual animal for each condition; two-tailed Mann–Whitney test). (E) SP600125 treatment for 3 h decreases the mean JNK-KTR value among all cells in the 72 hpf spinal cord (n=4-7 animals over two experiments; two-tailed t-test with Welch's correction). (F) SP600125 treatment for 3 h decreases the proportion of cells with high JNK activity in the 72 dpf spinal cord (n=4-7 animals over two experiments; two-tailed t-test with Welch's correction). (G) Anisomycin treatment for 10 h causes cytoplasmic translocation of cJun-NES-Venus. Images shown are from the same individual fish over the course of treatment. Left: Maximum intensity projection of cJun-NES-Venus fluorescence (note nuclear ‘shadows’ in several dorsally located cells marked with yellow arrowheads). Right: Heatmap of calculated JNK-KTR values in each individual cell. (H) Anisomycin treatments for 3 and 10 h shift the distribution of JNK activity up within an individual animal (n=500 individual cell measurements within an individual animal for each condition; two-tailed Mann–Whitney). (I) Anisomycin treatments for 3 and 10 h increase the mean JNK-KTR value among all cells in the 96 hpf spinal cord (n=4-7 animals over two experiments; two-tailed t-test with Welch's correction). (J) Anisomycin treatments for 3 and 10 h increase the proportion of cells with high JNK activity in the 96 hpf spinal cord (n=4-7 animals over two experiments; two-tailed t-test with Welch's correction). a.u., arbitrary units; EtOH, ethanol. |