FIGURE SUMMARY
Title

Macrophage activation drives ovarian failure and masculinization in zebrafish

Authors
Bravo, P., Liu, Y., Draper, B.W., Marlow, F.L.
Source
Full text @ Sci Adv

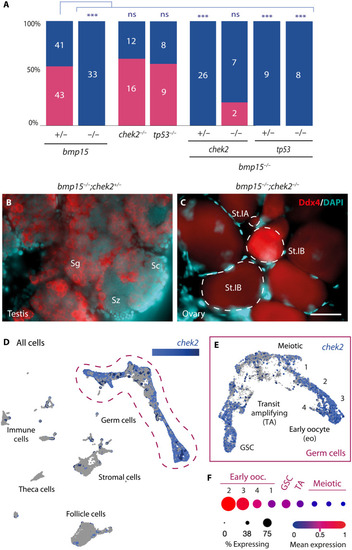
Loss of Chek2 suppresses oocyte death and sex reversal in the absence of Bmp15.

(A) Adult sex ratios of indicated genotypes. Female, pink; male, blue. Numbers indicate individuals examined. Statistical analysis: chi-square test with Bonferroni correction; P value comparisons to bmp15+/−, ***P ≤ 0.0001. ns, not significant. (B and C) Immunostained adult bmp15;chek2 gonads of indicated genotypes. Ddx4 (red) labels germ cells, and 4′,6-diamidino-2-phenylindole (DAPI; cyan) labels DNA. Scale bar, 50 μm. Sg, spermatogonia; Sc, spermatocyte; Sz, spermatozoa; St.IA, stage IA oocyte (prophase I meiotic cells in nests), St.IB, stage IB oocyte (late prophase within definitive follicles). (D and E) UMAP plot of chek2 expression in the 40-dpf ovary in (D) all cells, and (E) reclustered germ cells. (F) Analysis of chek2 expression profile in specific germ cells subclusters represented by dot plot graph. GSC, germline stem cells; TA, transit amplifying.

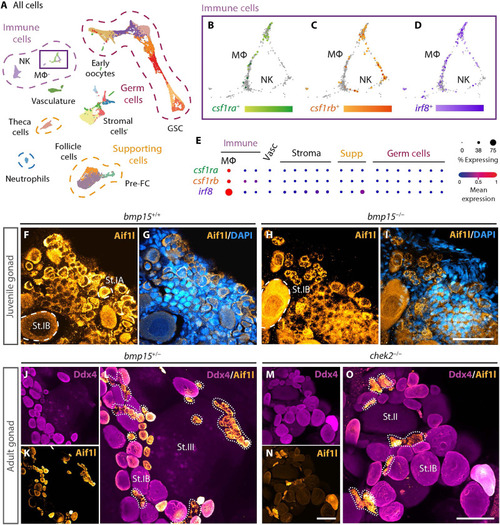
Macrophages are resident ovary cells in juvenile and adult zebrafish ovaries.

(A) UMAP plot of cell types present in 40-dpf ovary. (B to D) Magnified view of populations boxed in (A) showing expression of indicated genes. MΦ, macrophages; NK, natural killer–like cells; FC, follicle cells; GSC, germline stem cells; Vasc, vasculature. (E) Analysis of indicated macrophage gene expression profiles in ovarian clusters represented by dot plot graph. (F to O) Immunostained (F) to (I) juvenile and (J) to (O) adult gonads of indicated genotypes. Aif1l (yellow) labels macrophages, Ddx4 (magenta) labels germ cells, and DAPI (blue) labels DNA. Dotted lines mark macrophages. Scale bars, (F) to (I) 50 μm and (J) to (L) 100 μm. St.II, stage II oocyte (apparent cortical alveoli and a vitelline envelope); St.III, stage III oocyte (increased size and apparent yolk).

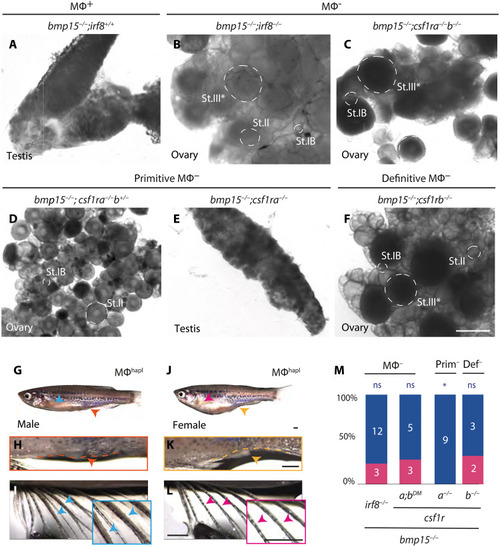
Definitive macrophages are required for ovarian failure and sex reversal of bmp15 mutants.

(A to F) Live tissue pictures of adult gonads of bmp15 mutants when macrophages are (A) present, (B) and (C) completely ablated, (D) haploinsufficiency of, or lack of (E) primitive, or (F) definitive populations. Scale bar, 500 μm. St.III*, arrested stage III oocyte (increased size and apparent yolk). (G to L) Secondary sex traits of adult: (G) male body shape, (H) urogenital papilla (orange dashed line and arrowhead), and (I) lateral fin tubercles (blue arrowheads and box); (J) rounded female body shape, (K) distinct urogenital papilla (yellow dashed line and arrowhead), and (L) absence of tubercles (pink arrowheads and box). Scale bars, 1 mm. (M) Adult sex ratios of indicated genotypes. Female, pink; male, blue. Numbers indicate individuals examined. Statistical analysis: chi-square test with Bonferroni correction; P value comparisons to bmp15+/−, *P ≤ 0.0125.

irf8 and csf1a are coexpressed in a subpopulation of pre-follicle cells in the early ovary.

(A) Analysis of expression profiles of indicated genes in specified clusters of ovarian cells represented by dot plot graph. (B to D) UMAP plot of indicated gene’s expression in the 40-dpf ovary in (B) and (C) follicle cells, and (D) reclustered subpopulation of pre-follicle cells. Subpopulation of pre-F cells boxed in (B) and (C). UMAP of reclustered pre-F cells; legend boxed in (D). (E) Gene expression correlation values of indicated genes in specified clusters of ovarian cells represented by Spearman’s Rho correlation analysis. (F to H) Double HCR RNA FISH confocal images of 40-dpf wild-type ovary. lhx9, follicle cells (magenta); csf1a, Csf1rs’ ligand (yellow), and DAPI, DNA (cyan). Regions boxed in (F) show magnified views of (G) lhx9/csf1a-coexpressing MAFCs and (H) csf1a-expressing somatic cells. Scale bars, 10 μm. F, follicle cells; Supp, supporting cells.

csf1a and il34 are detected in distinct follicle cell populations of the early ovary.

(A to C) UMAP plot of indicated gene’s expression in the 40-dpf ovary in (A) and (B) follicle cells, and (C) reclustered subpopulation of pre-follicle cells. Subpopulation of pre-F cells boxed in (A) and (B). UMAP of reclustered pre-F cells; legend boxed in (C). (D) Gene expression correlation values of indicated genes in specified clusters of ovarian cells represented by Spearman’s Rho correlation analysis. (E and G to I) Double HCR RNA FISH maximum projections of confocal images of 40-dpf bmp15 (E) heterozygous and (G) to (I) mutant ovaries. il34, red; csf1a, yellow; and DAPI (DNA), cyan. Asterisk (*) indicates blood cells. Regions boxed in (G) are magnified in (H) and (I). Scale bars, 10 μm. (F) Analysis of expression profiles of indicated genes in specified clusters of follicle cells represented by dot plot graph. MAFCs, macrophage-activating follicle cells.

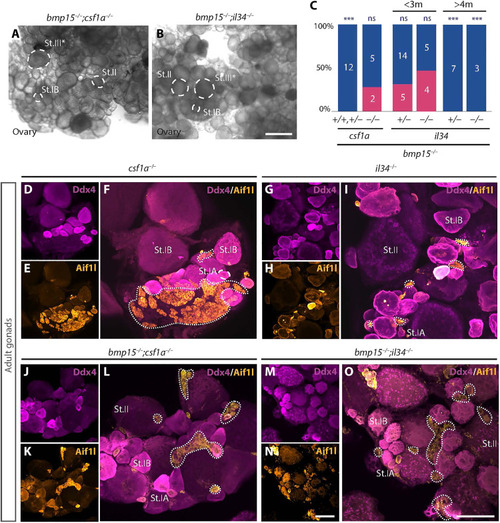
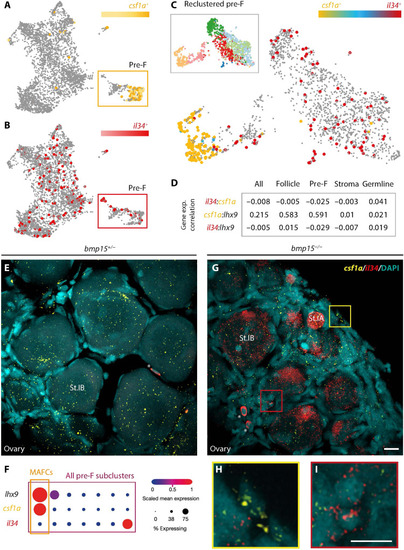
Il34 and Csf1a differentially contribute to ovarian failure and sex reversal and macrophages persist in csf1a- and il34-mutant ovaries.

(A and B) Live tissue images of adult gonads of indicated genotypes. Scale bar, 500 μm. (C) Graph with adult sex ratios of indicated genotypes. Female, pink; male, blue. Numbers indicate individuals examined. Statistical analysis: chi-square test with Bonferroni correction; P value comparisons to bmp15+/−, ***P ≤ 0.0001. (D to O) Immunostained adult gonads of (E) to (J) ligand single mutants, and (K) to (O) bmp15;ligand DMs of indicated genotypes. Aif1l (yellow) labels macrophages, Ddx4 (magenta) labels germ cells, and DAPI (blue) labels DNA. Dotted lines mark macrophages. Scale bars, 100 μm.

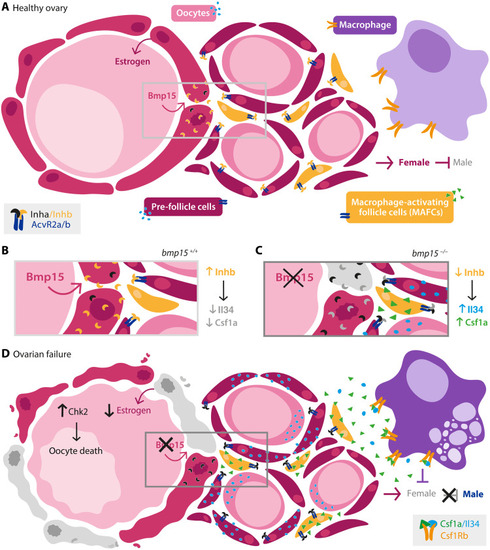
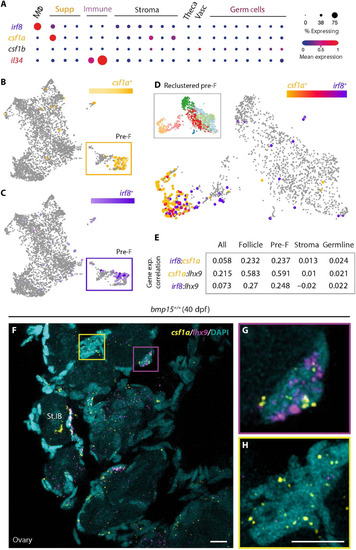
Model of germline-somatic-immune cell axis in healthy ovary and during ovarian failure.

Schematic depicts the signals and cellular players in (A and B) healthy ovary. Bmp15 from the oocyte signals to promote somatic follicle fates and survival such that the balance of Activins (Inhb) and Inhibins (Inha) prevents release of Csf1a and Il34 from pre-follicle cells and MAFCs, which express activin receptors, thereby blocking activation or expansion of macrophages. (C and D) During ovarian failure caused by loss of Bmp15, this balance tips to favor Inhibin a causing elevated Il34, and MAFCs to release Csf1a. Together, elevated Il34 and Csf1a trigger macrophage activation and activation of programs that regulate ovary-to-testis remodeling and sex reversal in zebrafish. (B) and (C) Enlarged views of regions boxed in (A) and (D).

Acknowledgments
This image is the copyrighted work of the attributed author or publisher, and ZFIN has permission only to display this image to its users. Additional permissions should be obtained from the applicable author or publisher of the image. Full text @ Sci Adv