IMAGE

Fig. 1.

ID
ZDB-IMAGE-231126-1
Source
Figures for Bravo et al., 2023
Image
Figure Caption

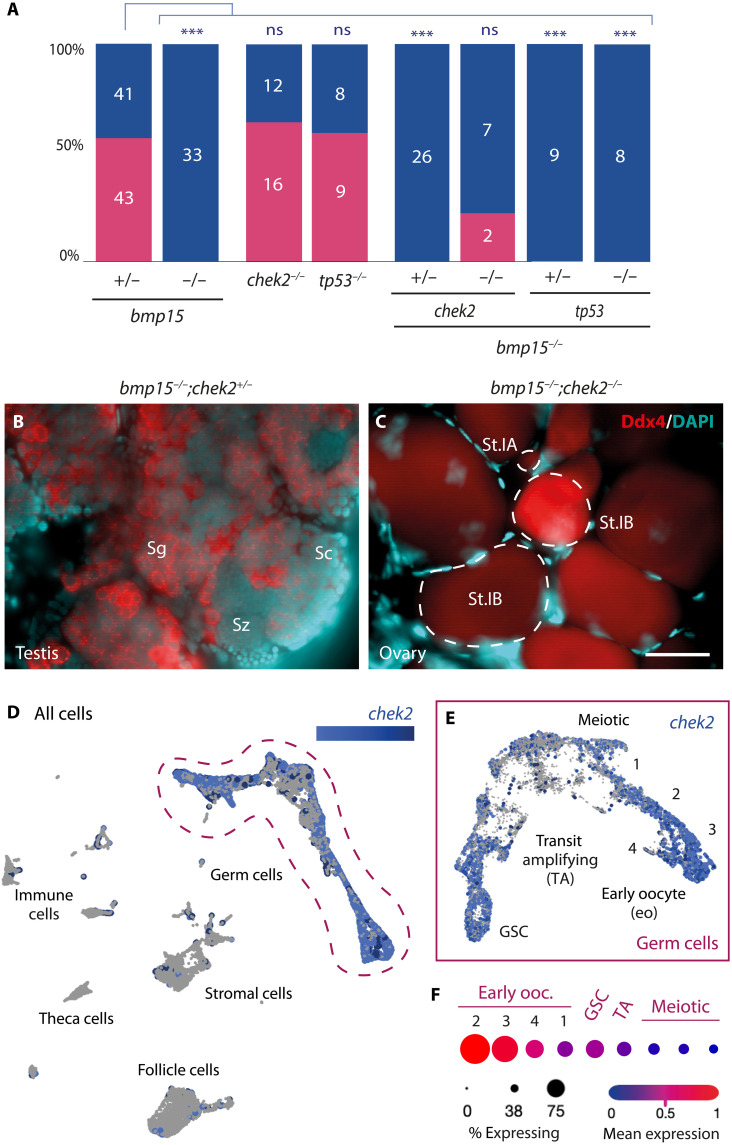
Fig. 1. Loss of Chek2 suppresses oocyte death and sex reversal in the absence of Bmp15.

(A) Adult sex ratios of indicated genotypes. Female, pink; male, blue. Numbers indicate individuals examined. Statistical analysis: chi-square test with Bonferroni correction; P value comparisons to bmp15+/−, ***P ≤ 0.0001. ns, not significant. (B and C) Immunostained adult bmp15;chek2 gonads of indicated genotypes. Ddx4 (red) labels germ cells, and 4′,6-diamidino-2-phenylindole (DAPI; cyan) labels DNA. Scale bar, 50 μm. Sg, spermatogonia; Sc, spermatocyte; Sz, spermatozoa; St.IA, stage IA oocyte (prophase I meiotic cells in nests), St.IB, stage IB oocyte (late prophase within definitive follicles). (D and E) UMAP plot of chek2 expression in the 40-dpf ovary in (D) all cells, and (E) reclustered germ cells. (F) Analysis of chek2 expression profile in specific germ cells subclusters represented by dot plot graph. GSC, germline stem cells; TA, transit amplifying.

Acknowledgments
This image is the copyrighted work of the attributed author or publisher, and ZFIN has permission only to display this image to its users. Additional permissions should be obtained from the applicable author or publisher of the image. Full text @ Sci Adv