FIGURE

Fig. 5.

ID
ZDB-FIG-231126-5
Publication
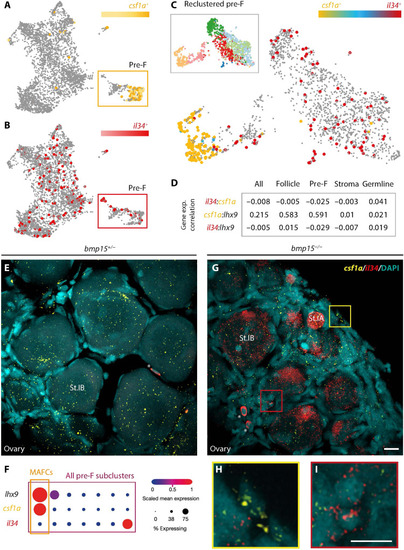
Bravo et al., 2023 - Macrophage activation drives ovarian failure and masculinization in zebrafish
Other Figures
All Figure Page
Back to All Figure Page
Fig. 5.

csf1a and il34 are detected in distinct follicle cell populations of the early ovary.

(A to C) UMAP plot of indicated gene’s expression in the 40-dpf ovary in (A) and (B) follicle cells, and (C) reclustered subpopulation of pre-follicle cells. Subpopulation of pre-F cells boxed in (A) and (B). UMAP of reclustered pre-F cells; legend boxed in (C). (D) Gene expression correlation values of indicated genes in specified clusters of ovarian cells represented by Spearman’s Rho correlation analysis. (E and G to I) Double HCR RNA FISH maximum projections of confocal images of 40-dpf bmp15 (E) heterozygous and (G) to (I) mutant ovaries. il34, red; csf1a, yellow; and DAPI (DNA), cyan. Asterisk (*) indicates blood cells. Regions boxed in (G) are magnified in (H) and (I). Scale bars, 10 μm. (F) Analysis of expression profiles of indicated genes in specified clusters of follicle cells represented by dot plot graph. MAFCs, macrophage-activating follicle cells.

Expression Data

Expression Detail
Antibody Labeling
Phenotype Data

Phenotype Detail
Acknowledgments
This image is the copyrighted work of the attributed author or publisher, and ZFIN has permission only to display this image to its users. Additional permissions should be obtained from the applicable author or publisher of the image. Full text @ Sci Adv